| What Does The First Five Days In January Indicate? |
| By Price Headley |
Published
01/10/2009
|
Currency , Futures , Options , Stocks
|
Unrated
|
|
|
|
What Does The First Five Days In January Indicate?
Front page economic news tends to have broad impact on the markets, while other important news seems to slip past the masses. The January Effect is one of my favorite indicators that is routinely overlooked, yet it is very reliable. Did you know that the first five days of 2008 held the worst performance for the S&P 500 (down 5.32%), that was a warning of strong losses, which materialized into the worst annual performance in S&P 500 history? The First-Five-Days in January are crucial for the full-year outlook. Nobody has found the'perfect prediction model, yet the January Effect seems to work with a reasonable amount of consistency. Thursday's close marked the fifth trading day of 2009 so let's take an in-depth look at the historical accuracy as well as the current signal for 2009.
The January barometer that traders look at is the potential for the first five trading days of the New Year to be a harbinger of the market's direction for the coming year. The basic premise is that momentum at the start of the year sets the tone for the rest of the year.
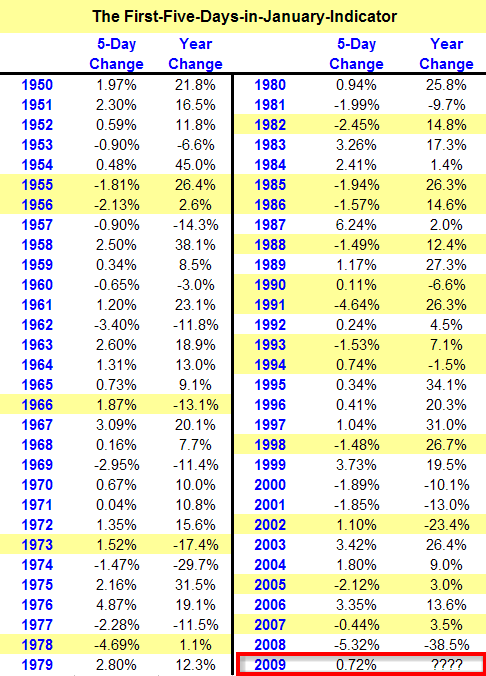
The idea is simple. Whichever way the fist five days goes, so goes January and so goes the entire year. Over the last 24 years, this theory has been accurate 70 percent of the time. I've charted the percentage changes for the S&P 500 in January over the last twenty-five years, and compared that to the corresponding annual changes.
S&P 500 Performance (First Five Day - Annual)

While the theory is not a full-proof indicator, it is more likely to be correct than not. More importantly, take a look at the results from the years highlighted in yellow (when the theory failed). You'll see that in absolute (negative or positive) terms the theory failed, however, the majority of failed predictions deviates a relatively small amount. While technically the theory failed, these years were 'near misses' where the annual gains were minimal following a first five days performance.
The counter-argument against this first-five-trading-days effect would be that the inherent bias built into the stock market is a bullish one, so again in January and a gain for the same year would just reflect natural market movement. The data may not imply a definite loss, but certainly implies that a gain is less likely and minimal at best.
So why does this indicator work? Perhaps the effect is coincidental, or perhaps it's a sign of simple momentum. Maybe it's even something of a self-fulfilling prophecy, where investors see a certain beginning, and that sets the tone for the entire year. But most likely it's something a little more scientific than that - with a clean slate (a New Year) and the previous year behind us, many investors begin taking positions within the first few trading days of the year. It is this trading, barring any substantial economic or political changes, that lets you know whether the public is thinking like a net seller, or a net buyer. For 2009, thus far, traders are net buyers (albeit mildly). If probability plays out, then 2009 will be a positive year for stocks.
Price Headley is the founder and chief analyst of BigTrends.com.
|