| Corcoran Technical Trading Patterns For January 12 |
| By Clive Corcoran |
Published
01/12/2009
|
Stocks
|
Unrated
|
|
|
|
Corcoran Technical Trading Patterns For January 12
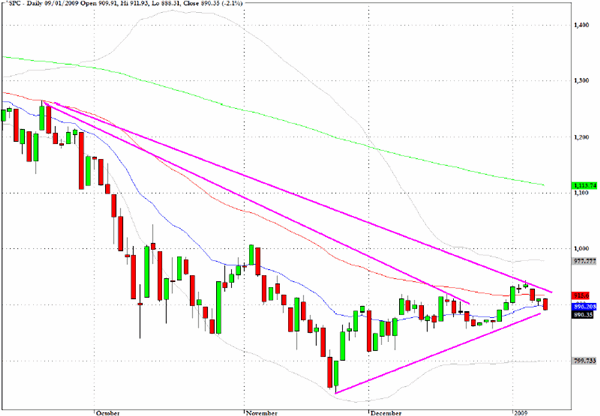
Friday’s sell-off which gained some pace into the close, although not on substantial volume, brought the S&P 500 down to a very critical level.
The 20-day EMA which is at 896 was breached but, perhaps more significantly, as the chart reveals the ascending line through the recent lows is arguably still intact. The strong triangular trend lines indicated on the chart suggest that there is still a presumption that the bulls will try to rescue the situation before any downside momentum gathers pace.
Although my intuition that we go up from here may be much influenced by the forthcoming inauguration with improving mood music of a refreshing breath of change in Washington etc., the technicals are not obviously breaking down. The bears were clearly attempting to regain control of the agenda in Friday’s session but there was scant evidence that long liquidation is picking up.
The bleak employment numbers were probably the best chance that the bears will have to rain on the inauguration parade and as of Friday’s close they were not able to prevail. If today’s session does not bring forth a more energetic selling bout with renewed fear, as evidenced by much higher VIX readings, the likelihood is that we drift higher for the remainder of the week.
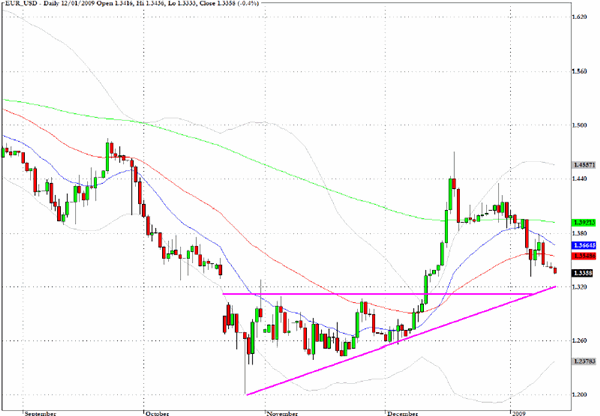
The euro is struggling from a technical point of view after the burst of strength that was seen in December. The $1.30 level is quite key for the currency and should we break down decisively this week we could see a re-visit to the low $1.20’s in short order.
In terms of the fundamentals there were some adverse developments for the currency last week which I noted in a contribution to another publication.
During the course of last week there was a noticeable lack of interest in the German Bund auction with the Bundesbank retaining 32% of the issue. The US government was able to sell a huge new issue of three year bonds with a bid to cover ratio of 2.2:1, which admittedly was somewhat weaker than the average bid to cover ratio, as reported by Bloomberg, but nevertheless it turned out a lot more successfully than the fears that are beginning to surface in the eurozone market. These fears were well captured in the following news report also from Bloomberg.
Jan. 7 (Bloomberg) -- Germany’s sale of 10-year bunds lured the least demand in six months as investors shied away from a flood of government securities, raising the prospect of increased borrowing costs for Europe’s biggest economy.
Investors bid for 5.2 billion euros ($7.1 billion) of the bonds offered today, a level of demand that prompted the Bundesbank to retain 32 percent of the securities, according to the central bank’s Web site. European governments want to raise money to finance more than $96 billion in bank bailouts and stave off the worst of the global recession. France may sell 7 billion euros of bonds tomorrow and Ireland began marketing five-year debt today. Spain is also planning a sale.
“I would call this a failed auction,” said David Keeble, head of fixed-income strategy in London at Calyon, the investment-banking unit of France’s Credit Agricole SA. “This was a very poor start of auction season.”
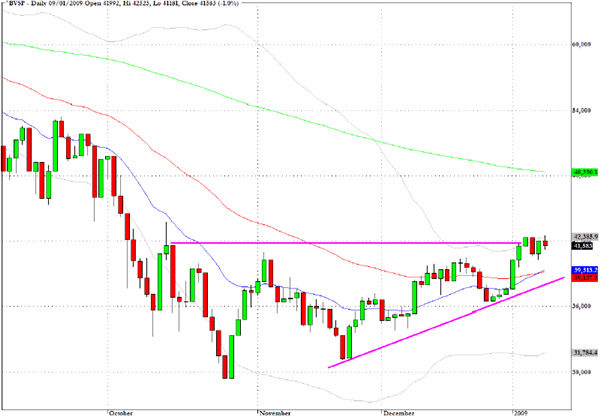
The Brazilian Bovespa Index (^BVSP) has one of the most positive indications of global indices that it could be ready to break out upwards from the strong triangular patterns which are very much in evidence.
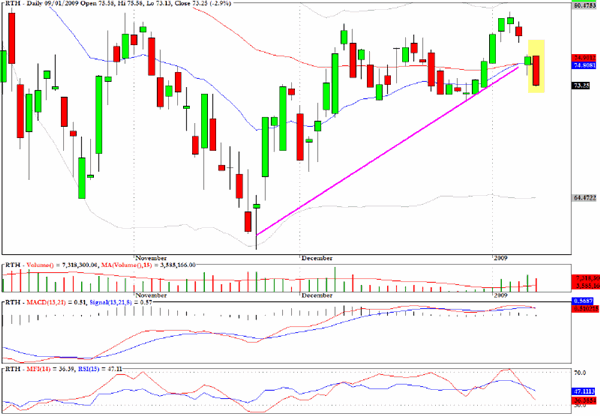
The S&P Retail Index (^RLX) has seen rejection several times at the 300 level and the pattern on the exchange traded fund RTH, which tracks the retailing sector, is revealing evidence that it could be about to break below a key uptrend line through the lows of the last three months.
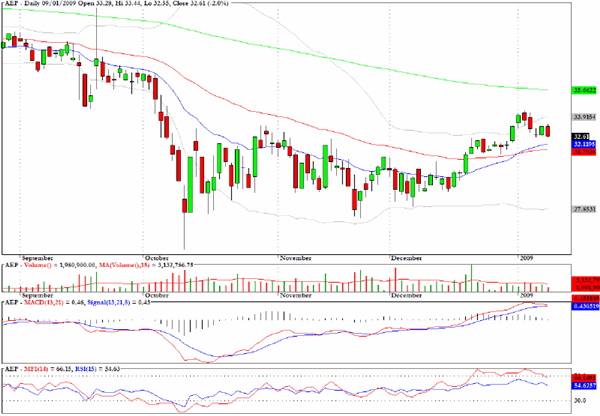
American Electric Power (AEP) trades quietly and is not for those looking for fast action, but the stock seems likely to find support for the long side at the $32 level.
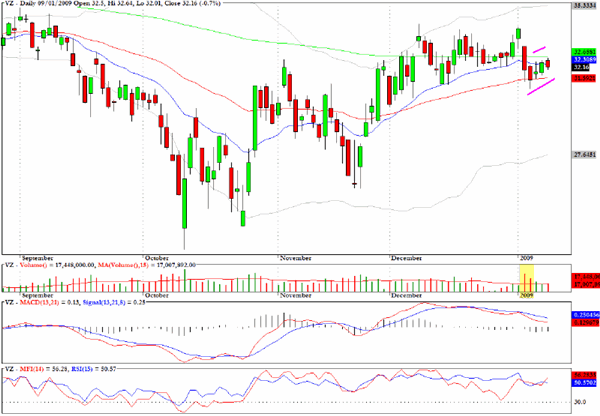
A bear flag is evolving on the daily chart for Verizon Communications (VZ).
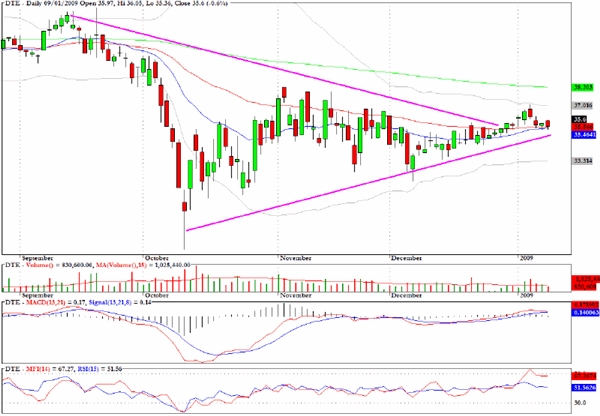
There are some interesting positive divergences on the chart for DTE Energy (DTE).
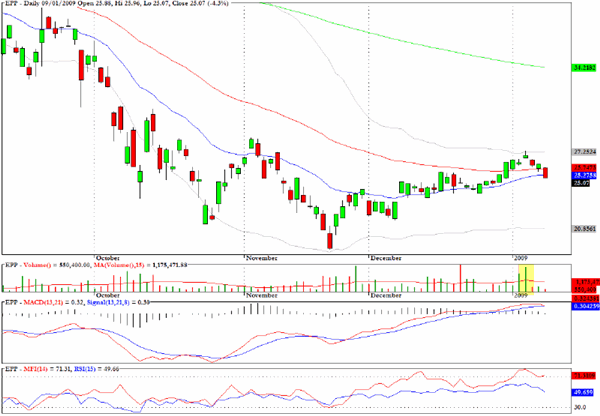
The exchange traded fund which tracks the MSCI Pacific, excluding Japan, Index, EPP, has generated a buy signal from one of the more reliable pattern scanning algorithms.
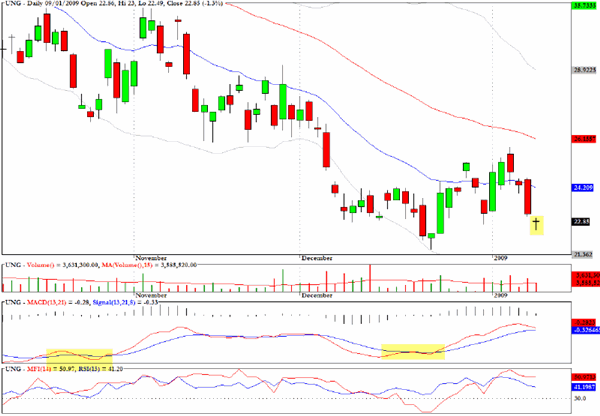
There would seem to be a relatively favorable reward/risk ratio on the long side for the exchange traded fund for the Natural Gas sector (UNG). The tiny doji star that resulted from Friday’s action, when it occurs at or close to multi-period lows is often a precursor to a trend inflection point.
Clive Corcoran is the publisher of TradeWithForm.com, which provides daily analysis and commentary on the US stock market. He specializes in market neutral investing and and is currently working on a book about the benefits of trading with long/short strategies, which is scheduled for publication later this year.
Disclaimer
The purpose of this article is to offer you the chance to review the trading methodology, risk reduction strategies and portfolio construction techniques described at tradewithform.com. There is no guarantee that the trading strategies advocated will be profitable. Moreover, there is a risk that following these strategies will lead to loss of capital. Past results are no guarantee of future results. Trading stocks and CFD's can yield large rewards, but also has large potential risks. Trading with leverage can be especially risky. You should be fully aware of the risks of trading in the capital markets. You are strongly advised not to trade with capital.
|