| Corcoran Technical Trading Patterns For January 13 |
| By Clive Corcoran |
Published
01/13/2009
|
Stocks
|
Unrated
|
|
|
|
Corcoran Technical Trading Patterns For January 13
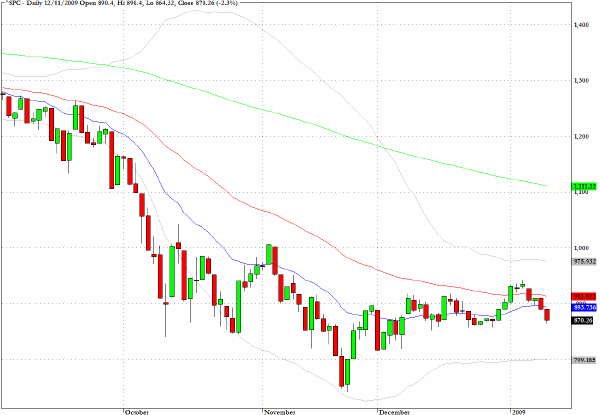
Yesterday's trading, which saw another 2.3% drop in the S&P 500, brings into focus the comments from yesterday's Daily Form commentary.
In my qualified assessment of where we might be heading for this week I made the point that:
The bleak employment numbers were probably the best chance that the bears will have to rain on the inauguration parade and as of Friday's close they were not able to prevail. If Monday's session does not bring forth a more energetic selling bout with renewed fear, as evidenced by much higher VIX readings, the likelihood is that we drift higher for the remainder of the week.
The reservations suggested with respect to the tone of trading on Monday would appear to have been satisfied although not overwhelmingly so.
The VIX picked up to approximately 46 and volume was heavier than last Friday's but this needs to be seen in the overall context of increasing volume as we move away from the holidays. Looked at simply in terms of the closing price in relation to the ascending trendline through the lows, it is now evident that this has been violated. Should we then expect a retest of the November lows?
A nagging doubt tells me that that eventuality seems too obvious in the short term.
I do believe that we will revisit those lows, and even have 680 as a probable value to be seen on the S&P 500 during 2009 but, assuming we do not plummet today - which certainly is more than possible - it seems likely that the market will continue to surprise us with more twists and turns before we go to these levels.
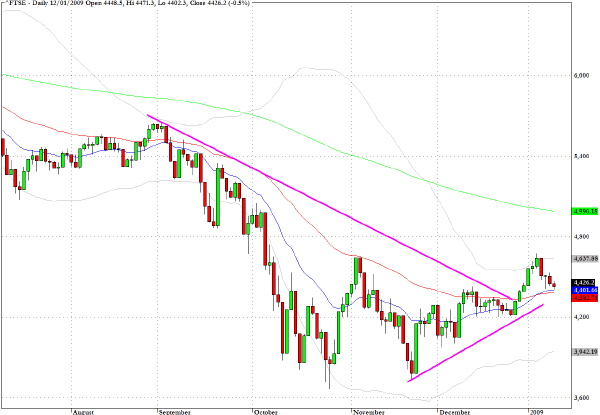
In early trading on Tuesday the UK's FTSE index has sought out the 4380 level which represents a key convergence of two moving averages and which was commented on here last week. Indeed at present time of writing the index is thoroughly testing this level and has pierced below it.
I shall discuss this chart in more detail during a slot on CNBC's European Closing Bell and point to the false breakout which is now becoming more apparent that coincided with the relatively quiet and low volume conditions of the turn of the year.
If the FTSE were to break below 4200 on a closing basis this would strongly point to a retest of the October and November lows in the region of 3750.
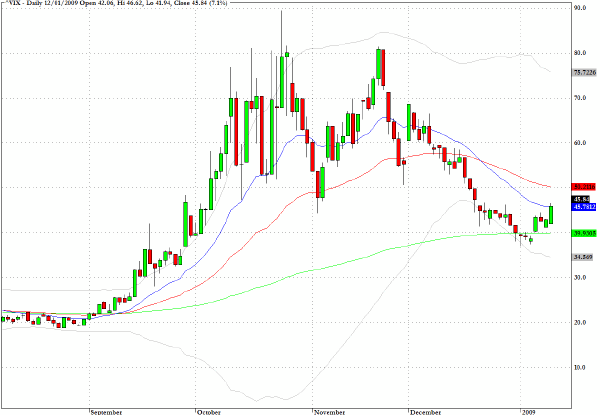
The continuation of selling yesterday following Friday's adverse reaction to the employment data produced a seven percent move up in the CBOE Volatility Index (VIX).
The 50 level is where the 50-day EMA is positioned and I would suggest watching this index today for evidence as to whether traders are becoming more anxious about a retest of the October/November lows or that, at least in the short term, trading desks are going to postpone the critical testing until more is known about the Q4 earnings releases.
The Alcoa numbers (AA) from last night will have reinforced the notion that the conditions are even worse than expected and today's reaction to those numbers, not only in relation to broad market prices, but also in the context of volatility, will be well worth monitoring.
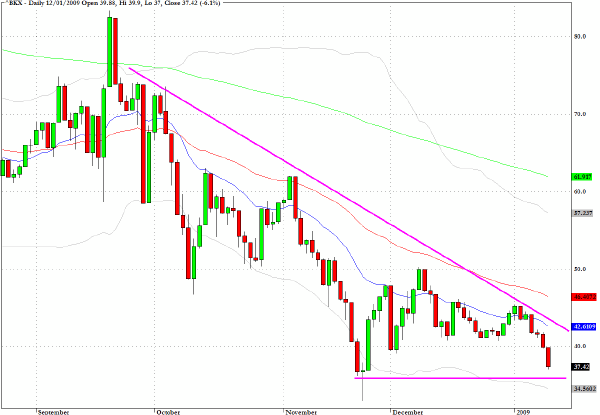
The banking index (^BKX) has followed the script of the descending wedge pattern and is on the threshold of breaking below the baseline.
I have made the point several times that it seems too much for the overall market to make any meaningful recovery until we see genuine indication that the major banks have found a base from which a recover, albeit a very gradual one, might be emerging.
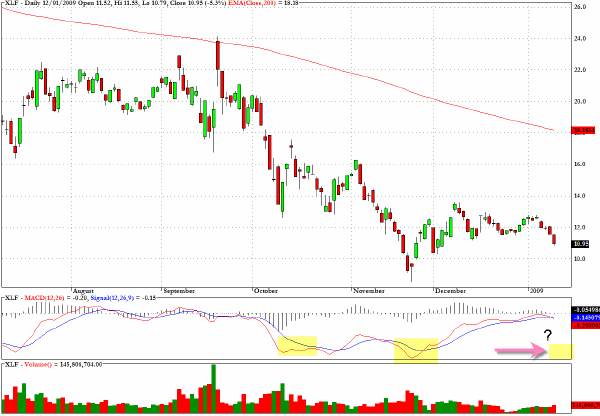
XLF, the exchange traded fund for the financial services sector, echoes the comments made above regarding the KBW Banking Index.
One indicator which would be quite bullish for the overall market in coming weeks would be to see the XLF seek out new lows below those seen in November and for the momentum indicator to reveal a positive divergence. I have annotated the chart with the question mark as to where the next MACD basing might arise. If that basing coincides with new lows in terms of price but higher in terms of MACD than seen in November, then we may be more confident in anticipating that the worst may finally have been fully priced in.
The preceding MACD lows from October and November show that there was no dissonance or positive divergence as the new lows in November were aligned with new lows in the MACD - this suggested as I have commented previously that the outlook for the financial services sector back then was one of relative under-performance, which has, in fact, been the case.
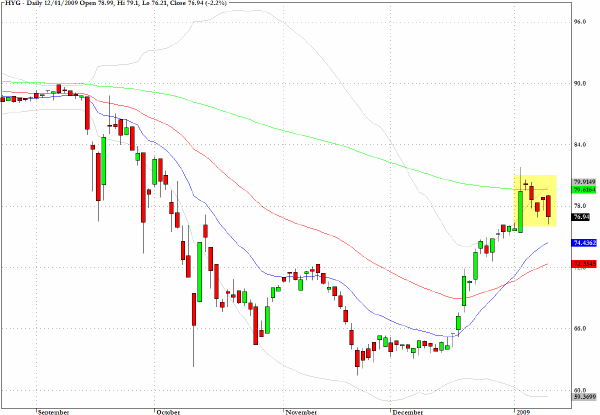
Recently I suggested that HYG, which tracks the high yield corporate bond market looked vulnerable at the 80 level after its strong rally in December. The sell-off over the last few days provides a further insight into the market's estimation of the severity of the current recession.
Many have suggested that the levels seen in early December were indicative that the market was contemplating a Depression but the enthusiasm that came into the market in mid-December suggested that a V shaped recovery was already under way. Clearly the market is having second thoughts that an imminent recovery can be discounted.
This index remains one of the more useful in gauging risk aversion/appetite.
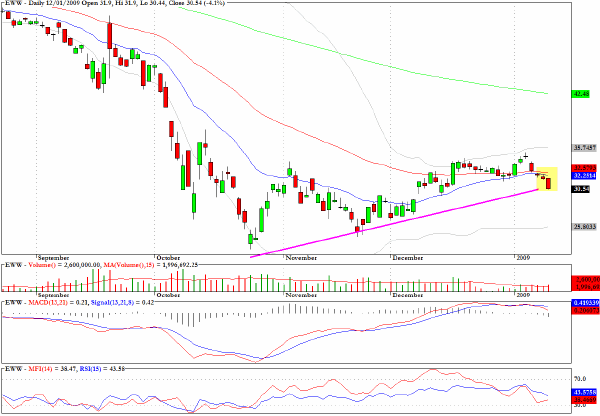
EWW tracks the MSCI Mexico Index, and in accordance with many indices, the ascending trendline since the October low has been clearly violated.
The notably weak readings on the MACD and MFI Charts suggest that expectations are building that this index is headed lower.
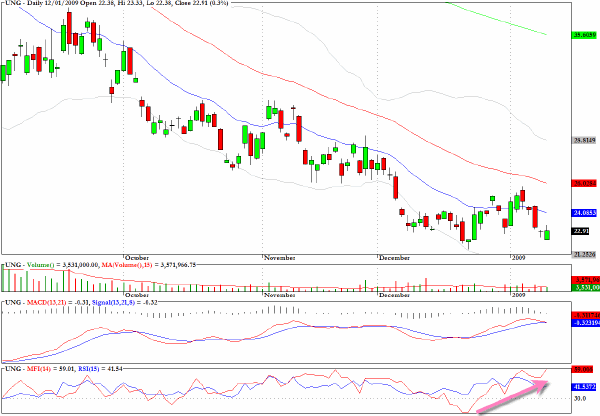
I am going to repeat my comments regarding UNG from yesterday.
There would seem to be a relatively favorable reward/risk ratio on the long side for the exchange traded fund for the Natural Gas sector (UNG). The tiny doji star that resulted from Friday's action, when it occurs at or close to multi-period lows is often a precursor to a trend inflection point.
One very notable feature of the chart below is the very positive divergence between the recent weak price performance and the MFI chart which clearly indicates that accumulation has been taking place.
Clive Corcoran is the publisher of TradeWithForm.com, which provides daily analysis and commentary on the US stock market. He specializes in market neutral investing and and is currently working on a book about the benefits of trading with long/short strategies, which is scheduled for publication later this year.
Disclaimer
The purpose of this article is to offer you the chance to review the trading methodology, risk reduction strategies and portfolio construction techniques described at tradewithform.com. There is no guarantee that the trading strategies advocated will be profitable. Moreover, there is a risk that following these strategies will lead to loss of capital. Past results are no guarantee of future results. Trading stocks and CFD's can yield large rewards, but also has large potential risks. Trading with leverage can be especially risky. You should be fully aware of the risks of trading in the capital markets. You are strongly advised not to trade with capital.
|