| Corcoran Technical Trading Patterns For January 15 |
| By Clive Corcoran |
Published
01/15/2009
|
Stocks
|
Unrated
|
|
|
|
Corcoran Technical Trading Patterns For January 15
Odds are certainly increasing that traders are not convinced that the low seen in November can be relied upon.
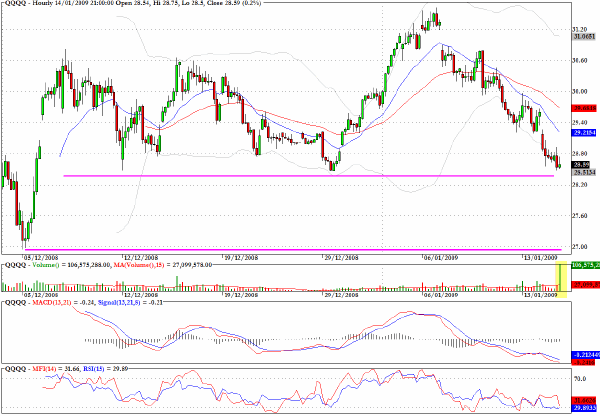
Looking at shorter-term potential targets on the downside, the following hourly chart for the Nasdaq 100 tracker, QQQQ, shows that yesterday's close was a good place to cover short positions for a possible bounce today but that the next target for the bears should be the December 5 levels around $27 as indicated on the chart.
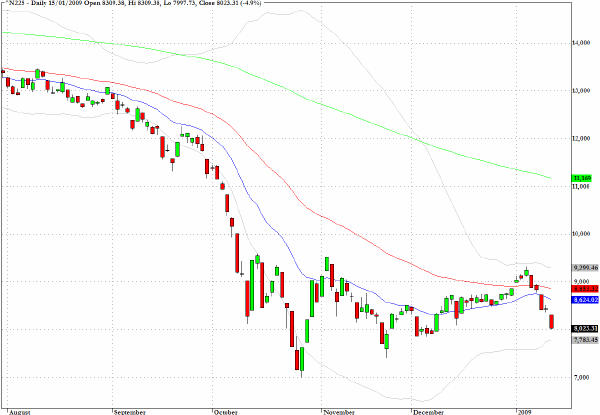
The Nikkei 225 (^N225) slumped in Thursday's trading and closed just above the 8000 level, raising the possibility that this market may need to retest the 25-year-plus lows that were recorded in late October.
Apart from the reaction to the adverse news from the US yesterday, Japanese traders also had the somewhat alarming news of a record 16.2 percent fall in Japanese machinery orders in November from the previous month.
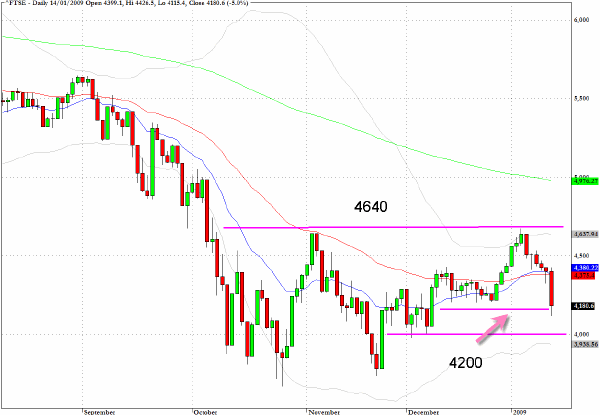
The FTSE broke down below the 4200 channel that had been in place since late November raising the possibility that this market needs to retest the next layer of potential support in the region of 4000.
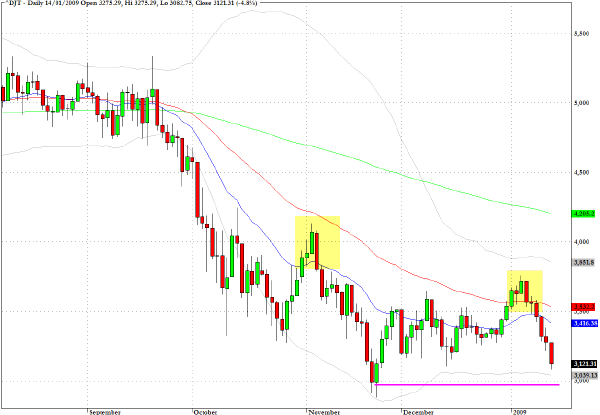
As intimated in yesterday's column, the Dow Jones Transportation Index (^DJT) has the weakest technical characteristics of the broad US indices and it fell more than other indices yesterday with an almost five percent drop and is closing in on the November low.
The two areas highlighted on the chart clearly reveal that this index fits remarkably into the classic descending wedge pattern with the exception of the two false breakouts indicated. The failure to break the downward slanting trendline illustrates the nature of a structural bear market where all attempts to rally are met with renewed selling. Whether we will break through the baseline, which seems increasingly probable, could be seen as soon as today.
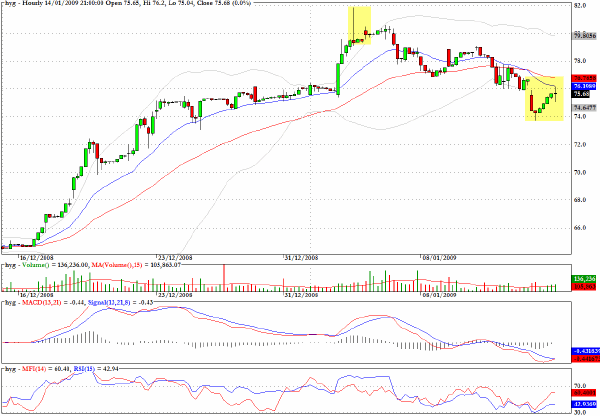
I have made several comments that HYG, which tracks the high yield corporate bond market looked vulnerable at the 80 level and it subsequently retreated and continued in that direction yesterday.
The hourly chart reveals a rather striking bear flag formation that emerged in yesterday's trading, suggesting that more weakness may lie ahead as the enthusiasm that emerged in late December dissipates.
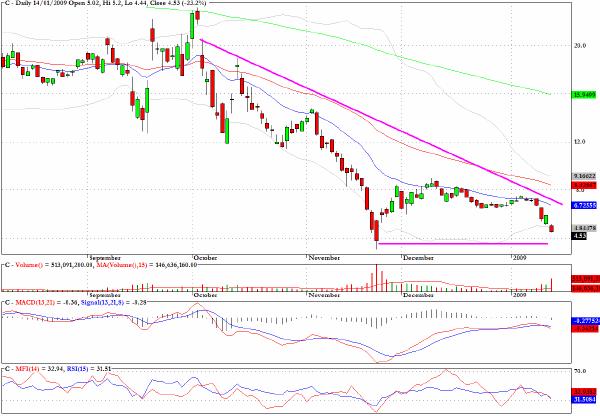
Citigroup (C) is approaching a critical level.
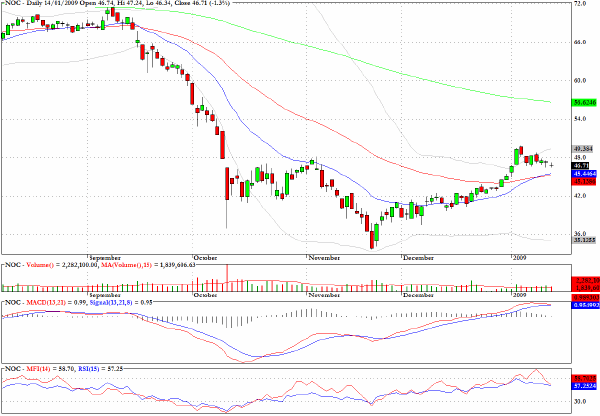
Northrop Grumman (NOC) reveals a tiny doji star in the context of a pullback pattern and may find support at the converged moving averages.
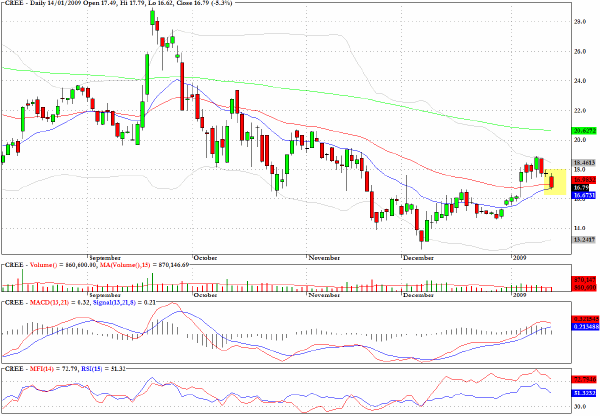
Cree (CREE) has also retreated to possible support levels but the long side is clearly subject to the risk that bearish index traders may be anxious to find the new bottom.
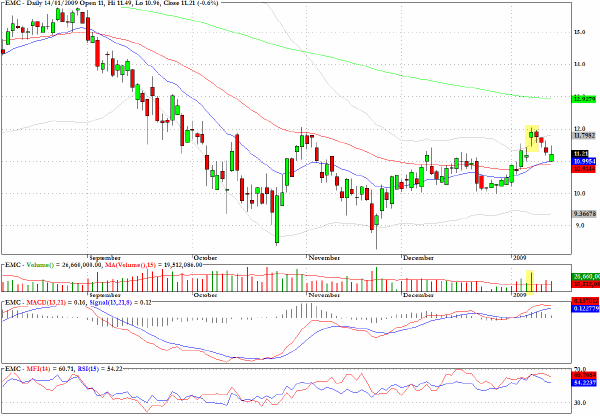
EMC is one of the long trades that I will be considering today if the market can stabilize for some kind of bounce.
Clive Corcoran is the publisher of TradeWithForm.com, which provides daily analysis and commentary on the US stock market. He specializes in market neutral investing and and is currently working on a book about the benefits of trading with long/short strategies, which is scheduled for publication later this year.
Disclaimer
The purpose of this article is to offer you the chance to review the trading methodology, risk reduction strategies and portfolio construction techniques described at tradewithform.com. There is no guarantee that the trading strategies advocated will be profitable. Moreover, there is a risk that following these strategies will lead to loss of capital. Past results are no guarantee of future results. Trading stocks and CFD's can yield large rewards, but also has large potential risks. Trading with leverage can be especially risky. You should be fully aware of the risks of trading in the capital markets. You are strongly advised not to trade with capital.
|