Strong Divergence in the Market Continues as the NASDAQ forms a Weekly Short Pattern
Good day! I hope you had a great weekend! The market continued its strong week's end rally on Friday with the SP500 and Dow Jones Ind. Ave. again leading the way as the NASDAQ lagged behind. It was a tough day overall, in my opinion. The day began with some pretty choppy trading after Thursday's strong late day rally. We did see the NASDAQ form that 15 minute Bull Flag I mentioned, but it went much more quickly than usual and the SP500 and Dow really just slowed their ascent instead of forming flags and the like. The pace on these picked up quickly as the 15 minute 200 sma broke in the NASDAQ with the 11:00 ET reversal period.
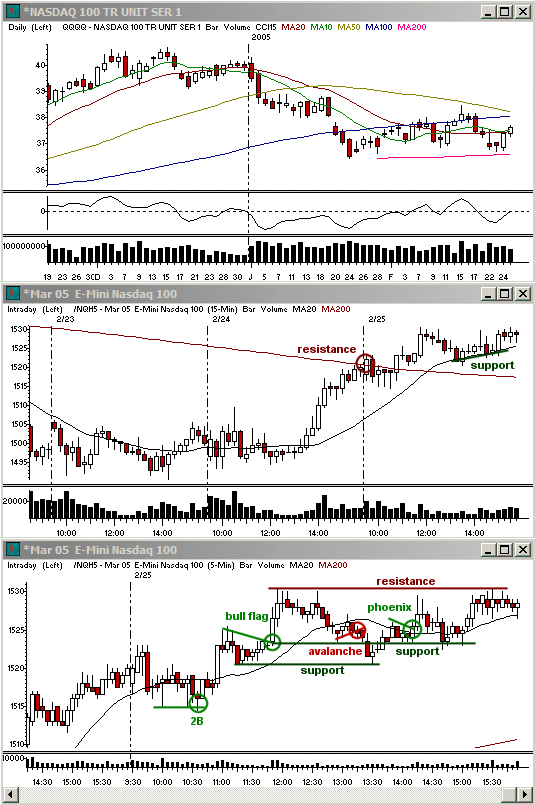
The upside stalled as the NASDAQ came into prior 5 minute highs, but at that point we saw a nice 5 minute Bull Flag. The volume dropped off nicely and the market put in a very narrow range. It triggered just before the 12:00 ET reversal period and ran enough to put in an equal move on the NASDAQ by 12:00, so that the reversal period held for highs going into the early afternoon.
The correction off mid-day highs was slow to begin with due to the strong pace of the rally. This resulted in three small waves of selling to allow for a correction back into the zone of the prior 5 minute breakout where it then found support with the 13:30 ET reversal period. At the same time the NASDAQ hit support at the 15 minute 20 sma and prices from the morning. Since the pace was more gradual overall, it made it likely we'd see a retest of highs going into the afternoon. The NASDAQ pulled back the most and that meant that prior highs would be strong resistance while the SP500 and Dow, which pulled back to a lesser degree would have better odds for new highs.
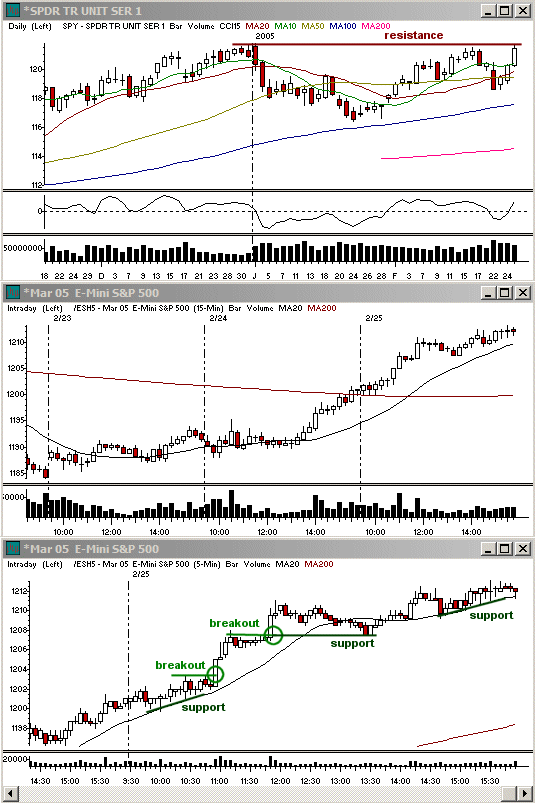
Shortly before 14:30 ET is when we saw the SP500 and Dow Jones break their 15 minute Bull Flags and run to new highs. A smaller 2 minute Phoenix helped kick off the move. After such a strong move already intraday though, the market really had a hard to picking up pace on this move. As the NASDAQ came into price resistance at prior high the indices fell into another range and the NASDAQ continued to hold that larger resistance. The SP500 and Dow did break small 5 minute triangles to close near day's highs, but the NASDAQ never managed to make new highs.
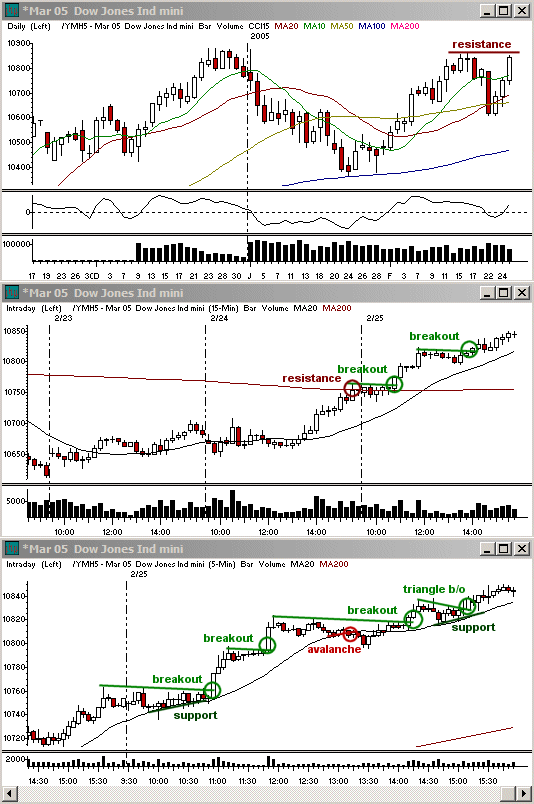
On the weekly NASDAQ chart we are seeing a larger Avalanche pattern form as it hugs the 20 sma support. The SP500 and Dow on the other hand are much strong, retesting prior daily highs and even looking to break higher. With the NASDAQ though, I remain cautious on these upside moves although I am not coming across any swingtrade short patterns at all and am mainly coming across Bull Flags like we saw last week. CVD and AFFX from last Monday's column are both doing pretty well and the 20 day sma is support in both. This week I'll be adding ANF to that list for a breakout buy as a swingtrade.
Toni Hansen is President and Co-founder of the Bastiat Group, Inc., and runs the popular Trading From Main Street. She can be reached at Toni@tradingfrommainstreet.com.


 Free Festival of Traders Videos