| Corcoran Technical Trading Patterns For January 22 |
| By Clive Corcoran |
Published
01/22/2009
|
Stocks
|
Unrated
|
|
|
|
Corcoran Technical Trading Patterns For January 22
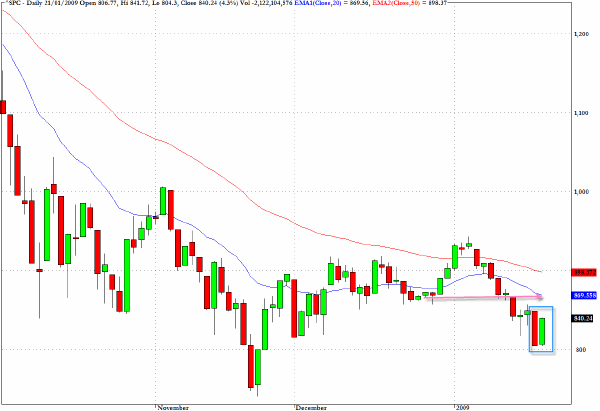
The S&P 500 cash index (^SPX) registered a pattern that was found on many charts after yesterday's recovery - an inside day reversal. The rebound was sharp and erased a lot of Tuesday's sell off but significantly the reversal failed to move outside the confines established by the intraday low and high from Tuesday. This strongly suggests that a lot of trading yesterday was short covering.
In terms of upward targets, 850 should bring out some sellers again but there is a case to be made that we could get back to the level indicated on the chart around 870. I would be looking to trade off the bounce again today but would begin looking at the short side if we venture beyond the 865 level.
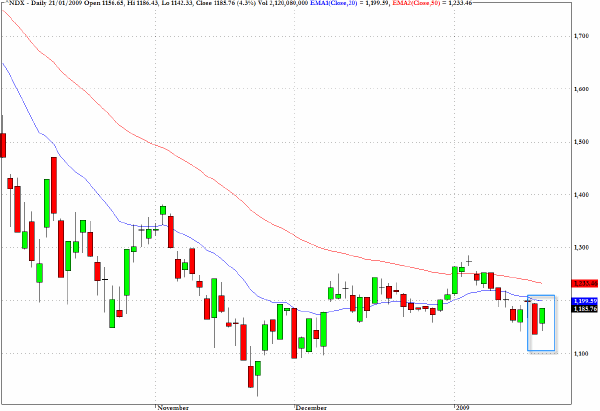
A similar pattern to the one noted above is seen on the chart for the Nasdaq 100 index and once again there is room for a continuation of the bounce but I would be looking at the short side again as traders try to make progress towards the 50-day EMA.
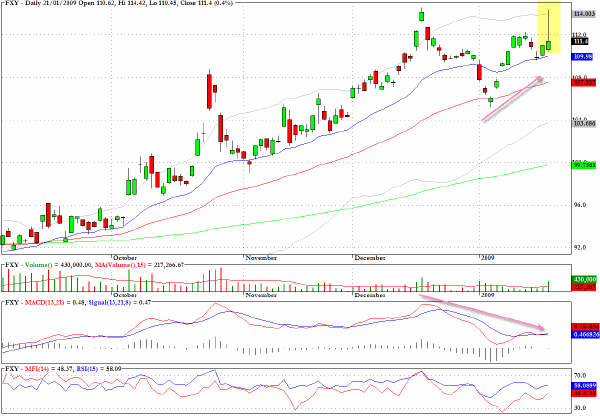
The Japanese yen looks vulnerable to corrective action. The shooting star pattern with the intraday pattern more or less at the December high is a very strong bearish signal.
The exchange traded fund FXY is revealing clear evidence of a negative MACD divergence and any strength today in the Japanese currency should be seen as providing better short opportunities.
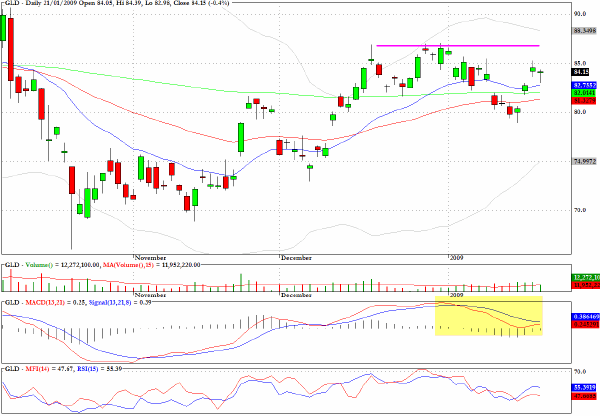
The chart for the ETF that track the price of spot gold GLD shows stiff overhead resistance and I suspect that we could see another abrupt sell-off in coming sessions.
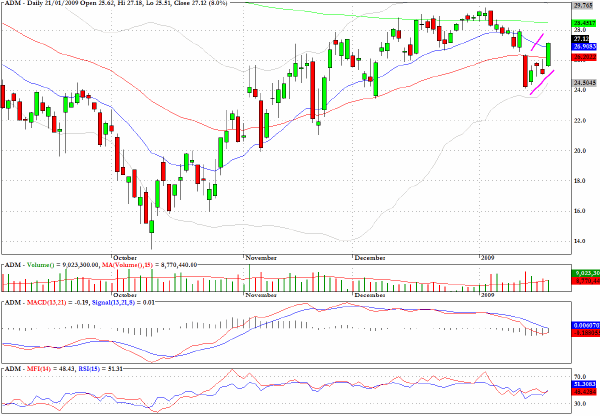
The chart for Archer Daniels Midland (ADM) reveals a bearish flag pattern.
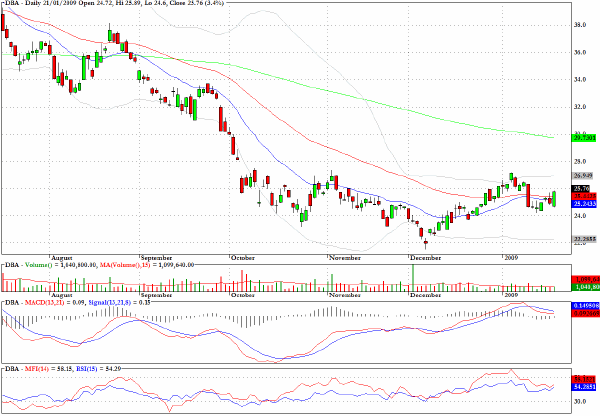
An ETF which tracks agricultural commodities, DBA, gained more than three percent yesterday but there is an eight session bearish flag pattern that suggests that this sector still has risks of further pullbacks.
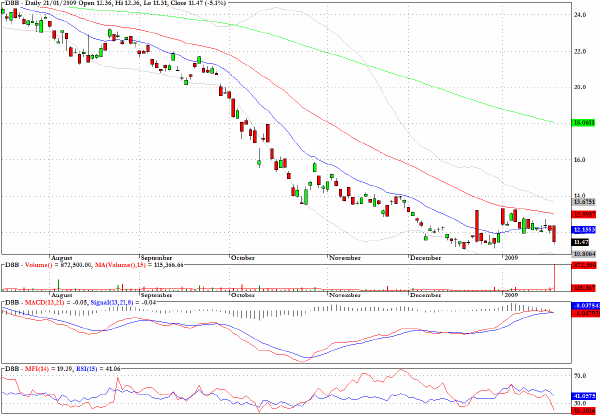
Another commodity focused ETF, DBB, which tracks the prices of base metals could have seen a selling climax yesterday, but any short term rebound should be traded nimbly.
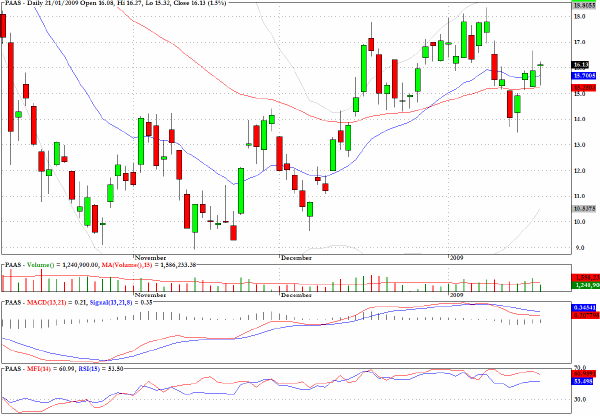
Pan American Silver (PAAS) has been whipsawing abruptly over the last several sessions and I would suspect that new efforts to head back towards $18 will bring out the short sellers.
Clive Corcoran is the publisher of TradeWithForm.com, which provides daily analysis and commentary on the US stock market. He specializes in market neutral investing and and is currently working on a book about the benefits of trading with long/short strategies, which is scheduled for publication later this year.
Disclaimer
The purpose of this article is to offer you the chance to review the trading methodology, risk reduction strategies and portfolio construction techniques described at tradewithform.com. There is no guarantee that the trading strategies advocated will be profitable. Moreover, there is a risk that following these strategies will lead to loss of capital. Past results are no guarantee of future results. Trading stocks and CFD's can yield large rewards, but also has large potential risks. Trading with leverage can be especially risky. You should be fully aware of the risks of trading in the capital markets. You are strongly advised not to trade with capital.
|