| Corcoran Technical Trading Patterns For January 26 |
| By Clive Corcoran |
Published
01/26/2009
|
Stocks
|
Unrated
|
|
|
|
Corcoran Technical Trading Patterns For January 26
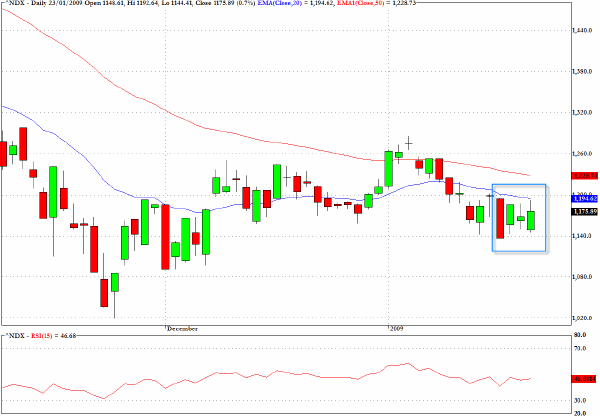
Last week, shortened as a result of the holiday on Monday, managed to reveal a rather unusual pattern on the chart for the Nasdaq 100 index (^NDX) that can best be described as an inside week - in the sense that the outer bounds of the weekly range were established in Tuesday's session and not transgressed during the rest of the week's trading.
The tech sector appears to be meandering, as echoed in the relatively neutral reading on the RSI chart segment, although several other indices are close to critical testing. One of the reasons that I am becoming more focused on the big tech stocks is the fact that I would expect them to show leadership qualities in the coming weeks - even if that is to lead the overall market down. As others have observed, the market capitalization of the S&P 500 has been shifting significantly away from the financials over the last two years - in 2006 they accounted for more than 20% of the index capitalization - now only 10% - whereas the technology sector is now the dominant sector in the US broad index.
Overall we seem to be in a trading range, but always with the possibility that index traders will want to have another shot at seeking out lows below those seen in November 2008.
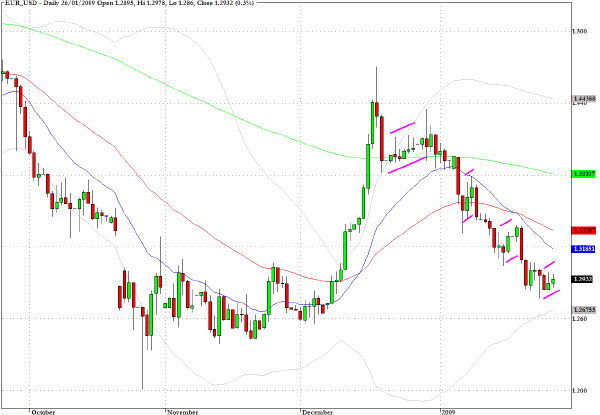
The chart for the Euro versus the US dollar looks remarkably bearish. As I noted in a CNBC slot last Friday, there is a formation that I have described as downward staircase pattern. This consists of a succession of small bear flags which followed the climactic buying that took place in early December. Targets at or even just below $1.20 could be attainable in the intermediate term.
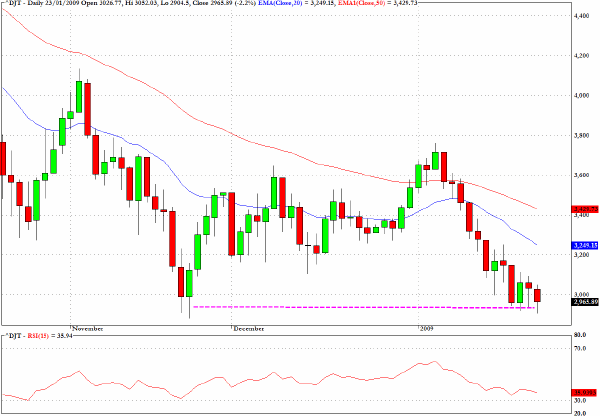
The Dow Jones Transportation (^DJT) is flirting with the November 2008 low. The most positive thing that can be said about the technical condition of the chart below is that the current RSI readings are slightly above the values seen in November.
But, of course, this could easily be erased with another nasty sell-off.
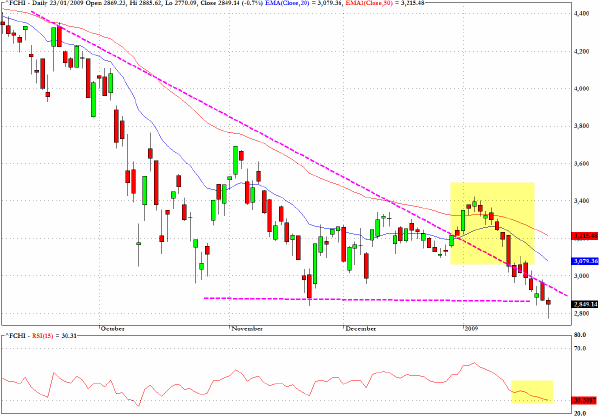
Also discussed on the CNBC slot last Friday was the chart for the French index - the CAC40. This is not an index that I follow too closely, but the story is quite interesting as it did close at a new multi-year low on Friday and the evidence from the downward wedge pattern suggests, as I mentioned, that the index is hanging on by its fingertips.
Of the major European indices the CAC40 is the closest to the March 2003 lows - about 15% away from those levels. The overall outlook for the eurozone economies is declining rapidly and it would not be surprising to witness some breakdowns in the national equity indices.
While writing this I am watching the price of Barclays bank in the UK shooting higher as the traders that were aggressively shorting this last week scramble to cover. At present the stock is up more than 70% - reminiscent of the days when dot com companies could gain as much by announcing that they had formed a Barney alliance.
Those were the days!
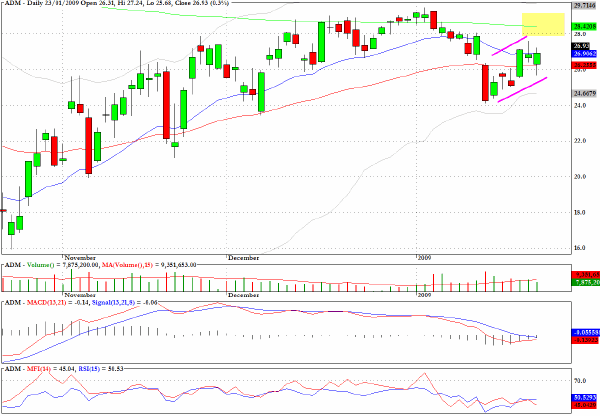
As I mentioned last week the chart for Archer Daniels Midland (ADM) reveals a bearish flag pattern.
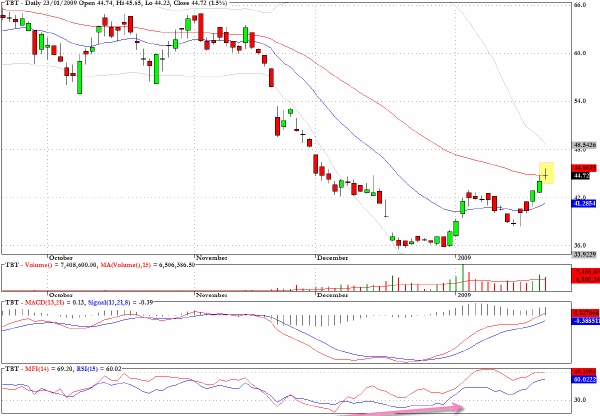
TBT is an inverse tracker to the price of long-term US Treasuries, so the price chart looks exactly like the yield chart.
Although I remain bearish on the long bonds in the longer term, the doji star that appears on the chart below also coincides with the 50-day EMA and could be suggesting that a short-term consolidation is beginning. For traders with longer time horizons, further pullbacks should be seen as buying opportunities, i.e. allowing further profits as yields increase.
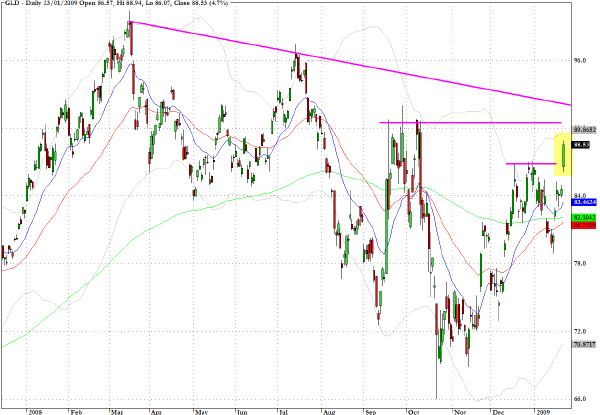
Friday's action in gold, GLD, took me somewhat by surprise as I expected to see more of a struggle at the more recent overhead resistance level seen on the chart below.
There are further layers of resistance, as shown, but I have learned that with such an emotional asset it is always better to retreat to the sidelines when the price dynamics become enlivened.
As other commentators will attest there is nothing guaranteed to cause more unfriendly feedback from newsletter readers than going against the grain of the most ardent gold enthusiasts.
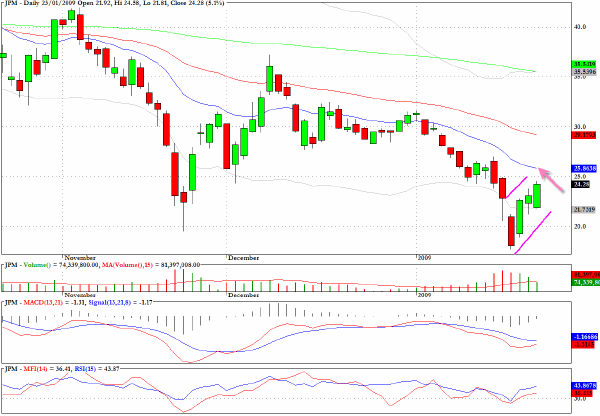
JP Morgan (JPM) has pulled back smartly from the selling seen last Tuesday but as the stock returns to the levels where the selling emerged one could see another attack by short sellers.
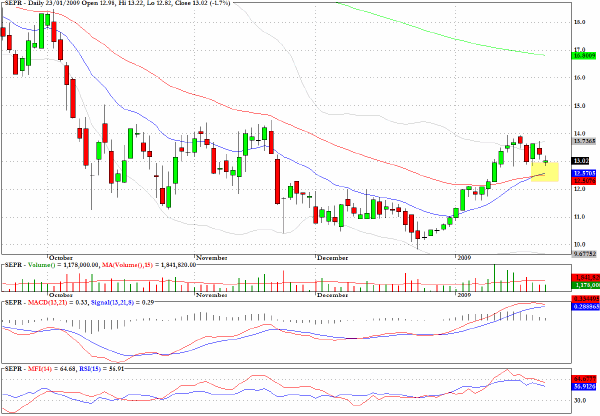
Sepracor (SEPR) would be worth considering on the long side as it approaches $12.50
Clive Corcoran is the publisher of TradeWithForm.com, which provides daily analysis and commentary on the US stock market. He specializes in market neutral investing and and is currently working on a book about the benefits of trading with long/short strategies, which is scheduled for publication later this year.
Disclaimer
The purpose of this article is to offer you the chance to review the trading methodology, risk reduction strategies and portfolio construction techniques described at tradewithform.com. There is no guarantee that the trading strategies advocated will be profitable. Moreover, there is a risk that following these strategies will lead to loss of capital. Past results are no guarantee of future results. Trading stocks and CFD's can yield large rewards, but also has large potential risks. Trading with leverage can be especially risky. You should be fully aware of the risks of trading in the capital markets. You are strongly advised not to trade with capital.
|