| An Examination Of Bollinger Bands |
| By Price Headley |
Published
01/26/2009
|
Currency , Futures , Options , Stocks
|
Unrated
|
|
|
|
An Examination Of Bollinger Bands
Want a sure way to be remembered in the financial world? Create a technical indicator, as it will often be assigned your name. If that indicator is widely used, long-term fame and remembrance are yours. This is written with some sarcasm, as it is an introduction to Bollinger Bands, which are a very popular and well-known chart analysis technique. This technical indicator was created by John Bollinger and bears the name of their creator. These bands allow technical analysts and traders to compare volatility (simply defined as the amount of risk about changes in a stock's value) and price levels throughout a given period of time.
Bollinger Bands are made of three components: a moving average, an upper band, and a lower band. Bollinger himself suggests a 20-day moving average, which will run right in the middle of the Bollinger Bands. The upper and lower bands (also referred to as the outer bands) are derived using two standard deviations. Standard deviation is a math formula used to determine volatility, demonstrating how far a stock's price can drift from its true value. (Note: All of these components can be adjusted by the investor to suit his/her investing needs.)
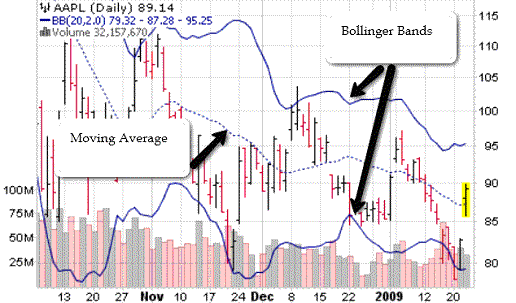
AAPL Chart with Bollinger Bands and Moving Average

The above chart of Apple (AAPL) shows the moving average (the dotted blue line) and Bollinger Bands (the solid blue lines). Notice that the bands mimic the movement of the stock, a characteristic attributed to the fact that a standard deviation is used in computation. Notice that the Bollinger Bands expand in some places and contract in others. When a stock sees high levels of volatility, the bands will expand. On the other hand, Bollinger Bands contract when the stock enters a trading channel. Some investors believe that the narrowing of Bollinger Bands is an early signal that a stock's volatility is about to stage a dramatic increase.
The overlying belief on the Street is that a stock is "overbought" (defined as a situation where irrational demand for a stock inflates the price) when it touches the upper Bollinger Band. When the lower Bollinger Band is continually tested, it is often an indicator that a stock is "oversold." (defined as a situation where a stock's price falls below its true value, thanks to market overreaction or 'panic selling") These situations often trigger sell (when a stock is overbought) and buy (when a stock is oversold) signals for traders.
I have additional ways of analyzing Bollinger Bands, which may be contrarian or tweaked from the conventional wisdom listed above. Many technical analysts will tell you that Bollinger Bands are one of the most useful trading tools available. While some may argue this fact, one can't argue against the popularity of Bollinger Bands. This indicator allows the savvy investor to take advantage of overbought and oversold conditions, which could lead to profits once the stock price regulates (or migrates back toward the center line). As noted earlier, the standard deviations used in Bollinger Bands can be tweaked to help the individual investor. We encourage you to do more research and determine exactly how Bollinger Bands (or any trading tool) can augment your trading strategy.
Price Headley is the founder and chief analyst of BigTrends.com.
|