NASDAQ COMMENTARY
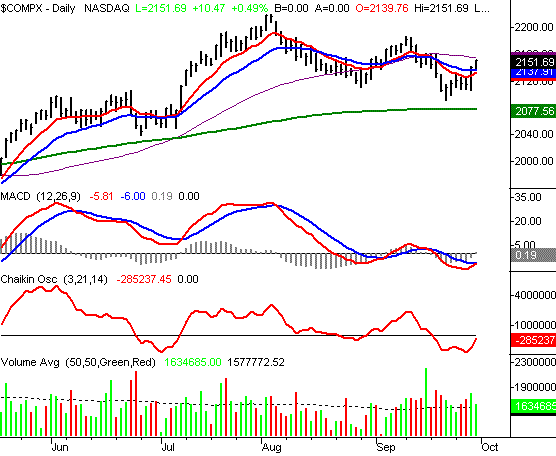
Last week, the NASDAQ Composite rallied from 2116.84 to 2151.69. That 34.85 point gain equates to a 1.6 percent move, which isn't bad at all, at least in the short-term. There's still a longer-term barrier ahead for the composite, but considering all the other indexes have crossed it with no problem, it shouldn't be a major issue here either.
By Thursday, the NASDAQ had managed to make its first close above the 10 and 20 day averages for the first time in 11 days. On Friday, it made an even higher close, which completes that important two-part, short-term buy signal. That big move on Friday also locked in a bullish MACD crossover - another big buy signal. We're taking these signals at face value, and getting bullish too. The volume behind this move has been solid, although tamed. We haven't yet seen a bullish Chaikin line signal, which is a cross above the zero level. We're near there, and with Thursday's and Friday's buying volume, we'll be looking for that Chaikin line cross soon.
The potential barrier is the 50 day line, currently at 2155.2. We have to acknowledge it, even though we don't think the composite will have much of a problem getting past that mark too. After all, the other indexes already have. After that, the recent peak at 2186.8 will be the next hurdle to jump.
NASDAQ CHART - DAILY

S&P 500 COMMENTARY
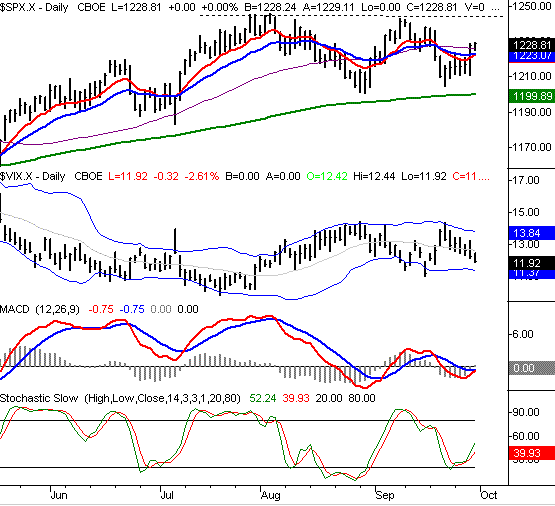
The S&P 500 gained a solid 13.52 points last week, to close at 1228.81. That 1.1 percent gain was enough to carry the index back above the 50 day line by Friday, so the bulls have something to get excited about......and not just for the near-term.
The S&P's gain on Friday was minimal, but it was still a second and higher close above the 50 day line, which is a major intermediate-term buy signal. It was already above the 10 and 20 day averages, so it had enough short-term strength to turn its bullishness into a longer-term pattern. To add to that upside pressure, we can see that we were near stochastically oversold by September 23rd, right as the VIX was coming off of that upper band line. Since then, the VIX has continued lower, the stochastic lines have moved higher (and out of oversold territory), while stocks, well, they've moved upward as the signals said they would.
The nice part for the bulls is this - we're still nowhere near the short-term ceilings. The VIX won't be at its lower band for at least a few days; the VIX is at 11.92, while the lower band is at 11.37 and dropping. The stochastic lines are at 52 and 40 - well under the 'overbought' threshold of 80. As for resistance on the S&P 500's chart, the next likely stopping point is this year's high of 1245. That's 31 points away from where we are now, which could make for a nice 'trade'. If we break past that 1245, it could get really exciting for the bulls.
S&P 500 CHART - DAILY

DOW JONES INDUSTRIAL AVERAGE COMMENTARY
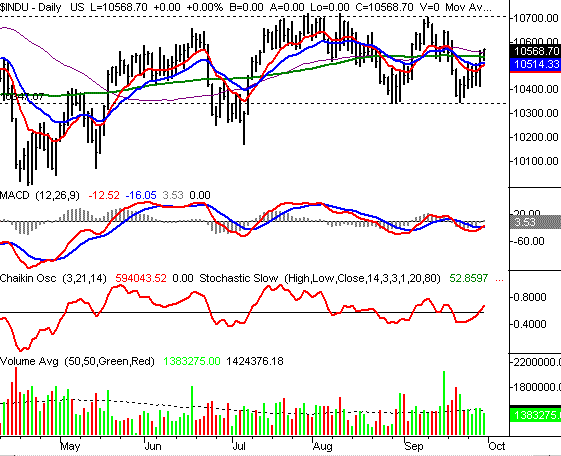
The Dow's 149.11 point rally was week left it at 10,568.70 by the end of Friday. That's a 1.4 percent gain, which was good enough to tip the scales in favor of bullishness in three distinct timeframes. So as we did a couple of weeks ago, we think the Dow Jones Industrial Average may finally be coming out of its long slump.
Like the S&P, the Dow is now above all of its key moving averages, just a few days after it was under all of them. The solid six-day recovery was good enough - and had enough volume behind it - to lock in a Chaikin line buy signal on Thursday. By Friday, we had a MACD buy signal too. So, we have to call them like we see them, and in this case, that's bullish.
But there's an important ceiling here too. The Dow hasn't been able to get any higher than 10,720 all year long. Were it just a problem in July & August we may not be as concerned, but that was pretty much where we peaked in September as well. Maybe the third pass will be different, but maybe not. For that reason, we're not going to be bullish in any timeframe except the short-term. However, note that 10,720 is only about 150 points away from where we closed on Friday. So, we could be making a big breakout in the very near future. In the meantime, we're excited about that potential 150 point gain.
DOW JONES INDUSTRIAL AVERAGE CHART - DAILY

Price Headley is the founder and chief analyst of BigTrends.com.