| Corcoran Technical Trading Patterns For January 27 |
| By Clive Corcoran |
Published
01/27/2009
|
Stocks
|
Unrated
|
|
|
|
Corcoran Technical Trading Patterns For January 27
There was a fairly constructive tone to US equities trading yesterday, perhaps partly inspired by some strong gains in Europe. As noted yesterday, Barclays bank was a major dynamic in trading throughout Europe yesterday after the bank provided some reassurances that it is not in urgent need of capital. Whether the markets continue to believe that remains to be seen but there was a massive short covering rally which even spilled over into trading in Asia overnight.
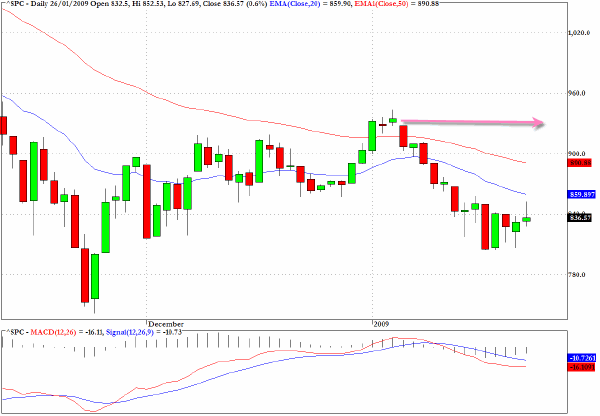
The S&P 500 (^SPC) is showing signs that a trading range regime is in effect with 800 or thereabouts as a downward limit and 930 as the upper limit.
Rather than attempting to read the tea leaves for each day-to-day move, one approach that some traders appear to be taking is one of being fairly detached and buying the index when the lower level is being approached and reversing as we come back towards the 900 level.
This may be the sanest way to play things until longer-term directionals become more apparent.
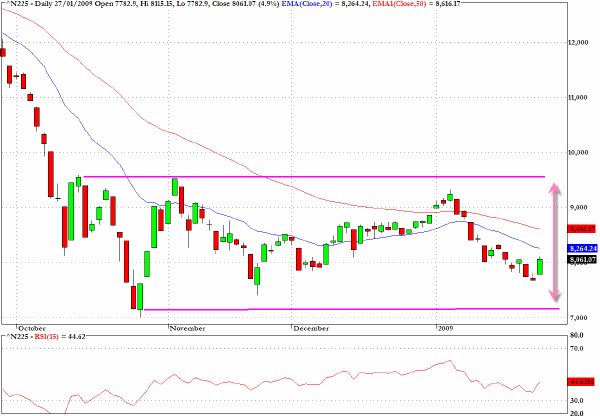
The Nikkei 225 (^N225) had a very positive session on Tuesday as the index leapt by almost five percent. Once again a trading range is evident.
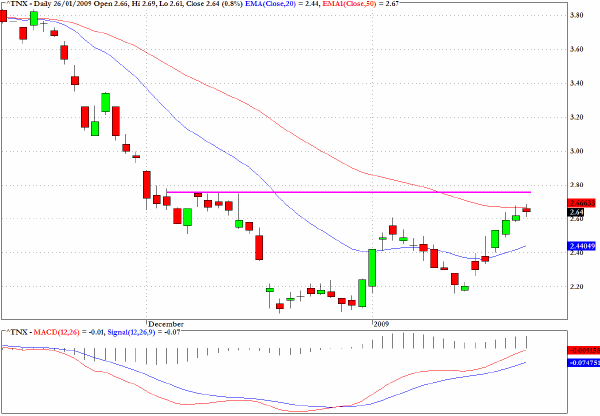
Yields on the ten-year Treasury note (^TNX) are slowing in their ascent and a 2.75% yield seems like a target during this week which will see a lot of refunding activity.
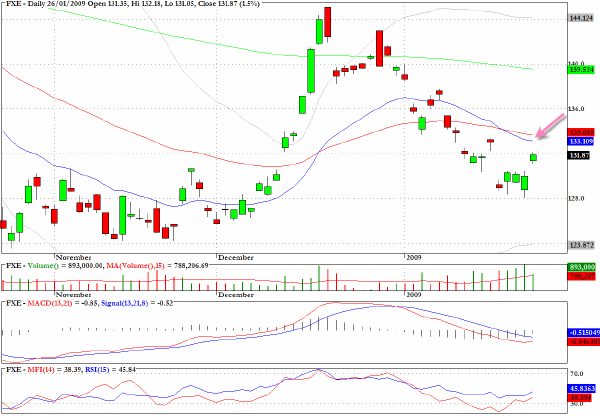
The exchange traded fund, FXE, will be on my radar screen for entry opportunities on the short side around $1.33.
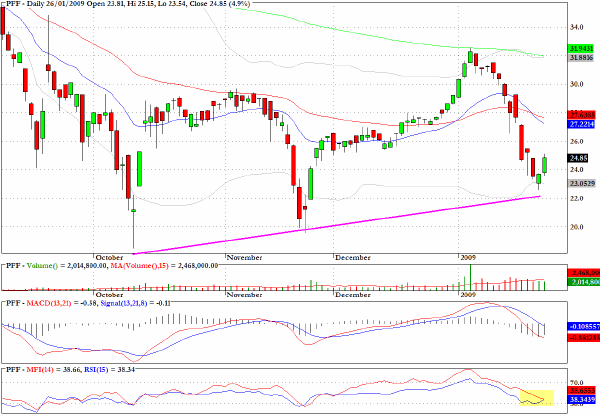
PFF, which tracks the S&P Preferred Stock Index, can provide useful insights into the appetite which institutions have for the less visible trade capital structure of the banks.
It is becoming one of the barometers that I am using for assessing, at least at a fairly simple level, the risk aversion/speculation matrix.
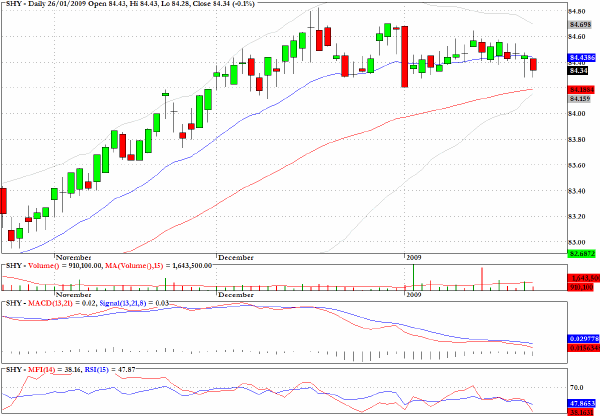
There are a huge variety of exchange traded funds focused on fixed income asset classes which provide good trading opportunities in the current environment.
The fund which tracks the short duration Treasuries (1-3 year), SHY, appears to be over-extended but may find support at the 50-day EMA (red line on chart).
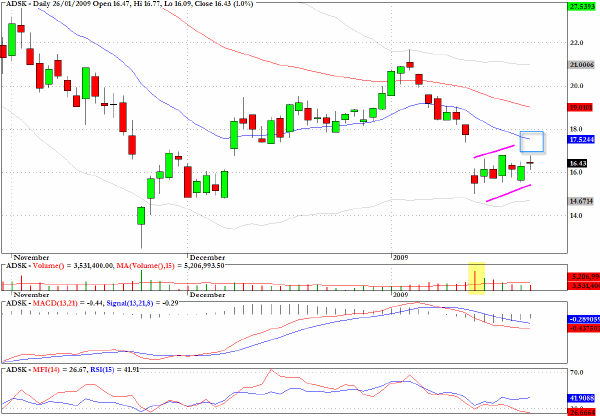
I would also be looking at Autodesk (ADSK) for opportunities to sell on any further rebound following the recent large gap down.
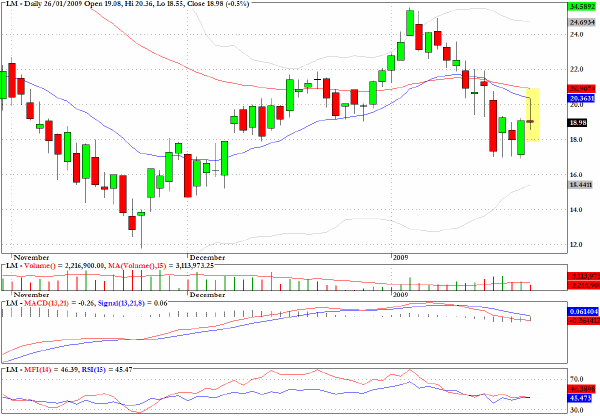
Legg Mason (LM) will be on my Watch List for a short term opportunity on the short side as a bearish pullback pattern is emerging.
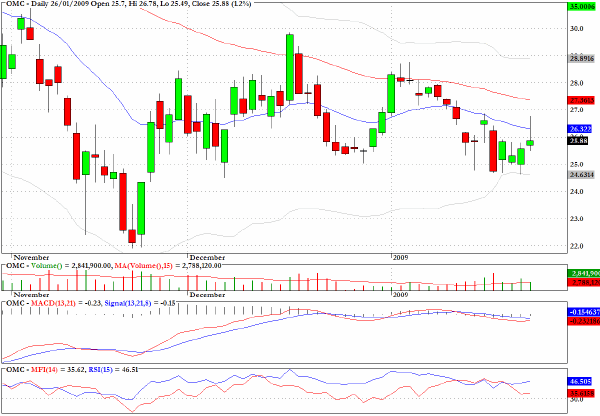
Omnicom (OMC) looks like it could be vulnerable to further weakness in the vicinity of $27.
Clive Corcoran is the publisher of TradeWithForm.com, which provides daily analysis and commentary on the US stock market. He specializes in market neutral investing and and is currently working on a book about the benefits of trading with long/short strategies, which is scheduled for publication later this year.
Disclaimer
The purpose of this article is to offer you the chance to review the trading methodology, risk reduction strategies and portfolio construction techniques described at tradewithform.com. There is no guarantee that the trading strategies advocated will be profitable. Moreover, there is a risk that following these strategies will lead to loss of capital. Past results are no guarantee of future results. Trading stocks and CFD's can yield large rewards, but also has large potential risks. Trading with leverage can be especially risky. You should be fully aware of the risks of trading in the capital markets. You are strongly advised not to trade with capital.
|