Good morning! The market put in a nice correction on Friday after a strong uptrend day. The open was slightly lower, but we didn't see much action until about 10:00 ET when the narrowing range on the 2 minute charts formed a triangle in the NASDAQ that broke higher after testing the highs of the range for the third time. This was a slower move than the rally into the base had been and the market began to gradually change pace. It stalled its ascent when the SP500 and Dow Jones Ind. Ave. hit Friday's highs and fell quickly back into the new range.
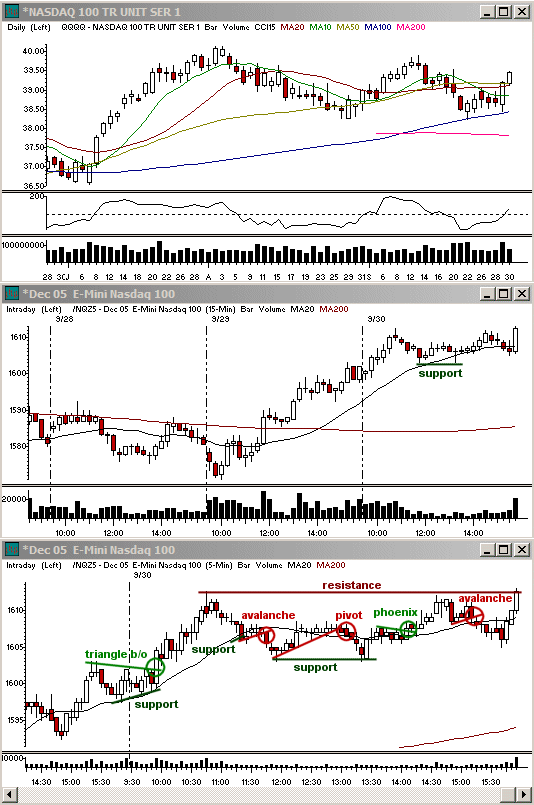
The pace to the downside remained strong when the market came into its 5 minute 20 sma support. Instead of bouncing, it based along it, forming an intraday Avalanche short setup that look the indices back into the smaller range from the open. This hit right at the 12:00 ET reversal period and the NASDAQ's 15 minute support sma support zone, causing a bit of a retracement into the early afternoon. When the 13:00 ET reversal period hit the market again retested these lows, but this time the pace was slower as a whole in the SP500 and a reversal pattern formed at 13:30 ET when the 5 minute 20 sma resistance gave way.
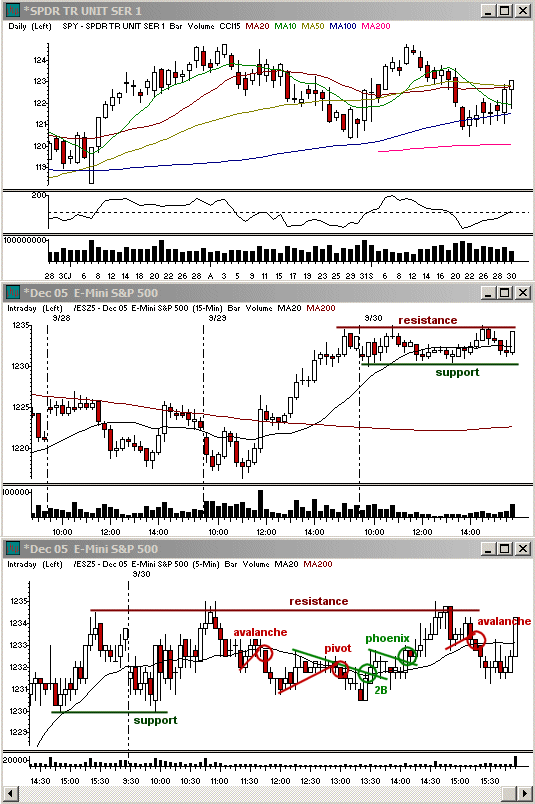
The market then fell into a small range along the 5 minute 20 sma. This time it served as support. The slower pace of the base on the downside aided in a breakout back to the morning highs coming out of the 14:00 ET reversal period. Volume remained thin, however, showing a lack of real conviction as the market formed one of the lightest volume days in recent trading. Pace again turned over on this move as the market pivoted sharply from the resistance to fall back to the 5 minute 20 sma where it formed another small Avalanche into 15:30 ET and back to the lower end of the range.
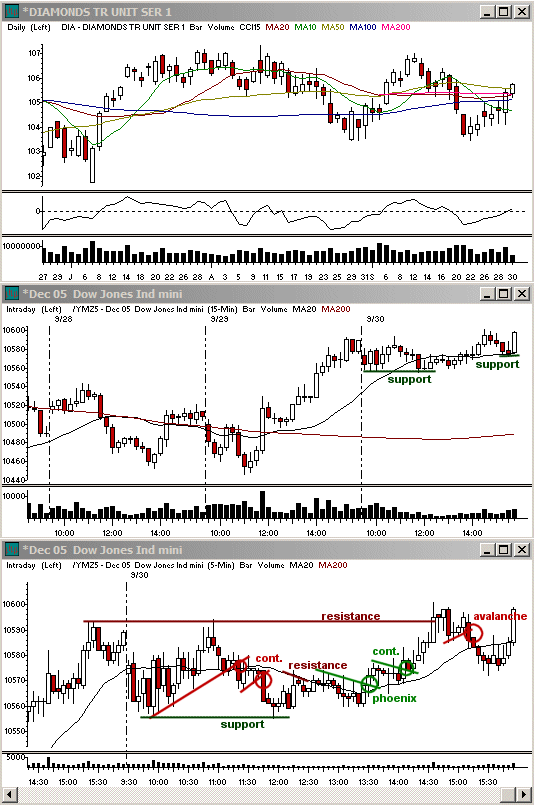
On the daily charts the market is no longer holding the lower end of the range like we were looking for going into the week and this is changing that bias as well. We need the market to hold one end of the range in order to form a strong setup for a breakout. Going into Friday I had expected a choppy day, but with a bit more downside than we got. This range closer to the highs is making the shorter term bias more bullish, but the market can very easily have another choppy narrow range day since often the correction to a trend move takes 1.5-2 times as long as the trend move.
Updates: Swingtrades: VRTX from the 12th hit targets for those not taken out with a trailing stop into the 10 day sma. UFPI long from last Monday will have support at the 20 day sma, while PWAV long from last Monday has support at $12.48. FRK from last Tuesday also has support at its 20 day sma. Position trades: HSP and CHRS long have support at the lows of the weekly bases. CHRS stopped out some folks on Tuesday, but is holding the 20 week sma support. I am looking at acquiring NTRS as a position trade buy on upside breakouts from the current range on the weekly chart, but it needs to hold the 20 week sma level to stay on my watch list. HCA as a position trade short from 9/20 hit trailing stops for a swing, but a larger position trade target is in the $43 zone.
Economic Reports and Events
Oct 03: Construction Spending for Aug (10:00 am), ISM Index for Sep (10:00 am), Auto Sales for Sep (12:00 am), Truck Sales for Sep (12:00 am)
Oct 04: Factory Orders for Sep (10:00 am)
Oct 05: ISM Services for Sep (10:00 am), Crude Inventories (10:30 am)
Oct 06: Initial Claims 10/01 (8:30 am)
Oct 07: Average Workweek for Sep (8:30 am), Hourly Earnings for Sep (8:30 am), Nonfarm Payrolls for Sep (8:30 am), Unemployment Rate for Sep (8:30 am), Wholesale Inventories for Aug (10:00 am), Consumer Credit for Aug (3:00 pm)
Oct 10: -
Oct 11: FOMC Minutes (2:00pm)
Earnings Announcements of Interest
Only stocks with an average daily volume of 500K+ are listed. List may not be complete so be sure to always check your stocks' earnings dates before holding a position overnight. (A) = Earnings after the close, (B) = Earnings before the open, (?) = Earnings time not specified at the time of this writing
Oct 03: CMGI (A), MOS (B)
Oct 04: -
Oct 05: RI (A), SLR (?), YUM (B)
Oct 06: CAN (A), ATYT (B), STZ (A), COST (?), MAR (B)
Oct 07: -
Oct 10: AA (A), DNA (A), NGAS (?), PKX (B)
Oct 11: AAPL (5:00 pm ET), GCI (B), LPL (?)
Toni Hansen is President and Co-founder of the Bastiat Group, Inc., and runs the popular Trading From Main Street. She can be reached at Toni@tradingfrommainstreet.com.


 Free Festival of Traders Videos