| The McMillan Options Strategist Weekly |
| By Lawrence G. McMillan |
Published
01/30/2009
|
Options
|
Unrated
|
|
|
|
The McMillan Options Strategist Weekly
A number of cross-currents are buffeting the market at this time. The bullish ones are mostly related to the positive seasonality surrounding month-end, especially January month-end. The negative ones are the traditional intermediate-term problems that have beset the market for a long time.
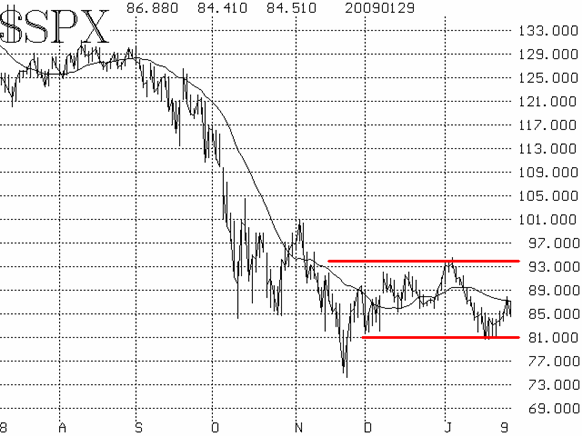
The $SPX chart is rather neutral, although both bulls and bears could make their case. With last week's decline bottoming out at 810 on four consecutive days, that area represents strong support. There is resistance at 920-930. So those two areas demarcate a trading range. Until there's a breakout over 930 or a breakdown below 810, it's a trading range.

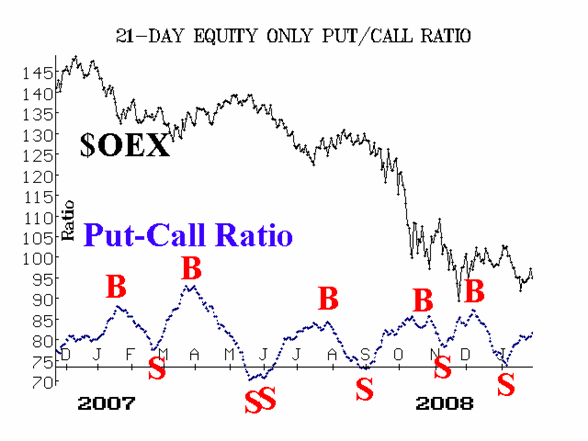
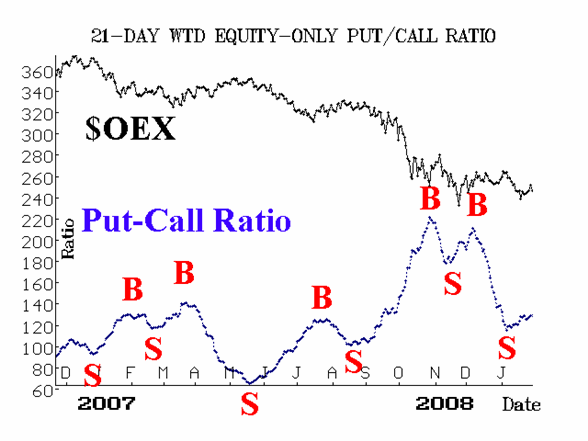
The equity-only put-call ratios appeared to be on the verge of giving buy signals earlier this week, but have failed to do so. The standard ratio has pushed to new highs, so it is clearly still on a sell signal. The weighted ratio looks like it is still rising, as well, which would be bearish.

Market breadth has been erratic. Wednesday was a "90% up day" and Thursday was a "90% down volume day." This sort of "all in" or "all out" mentality is not normal, and as long as it persists, there is high volatility -- and probably high danger as well. Technically, the breadth oscillators gave new sell signals with today's action.

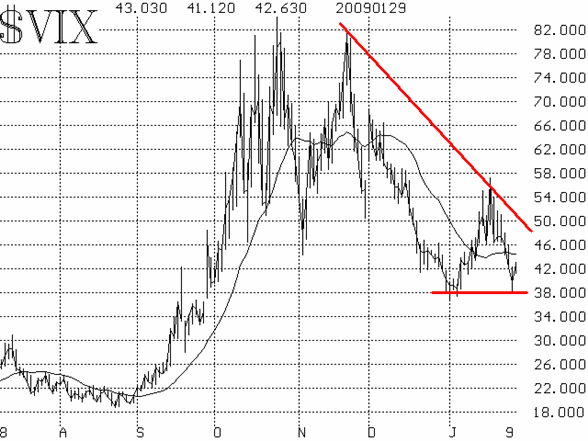
Volatility indices ($VIX and $VXO) have trended down strongly this week, re-establishing a bullish downtrend in volatility. However, $VIX bounced off the 38 level again today, just as it did at the beginning of this year. So, if $VIX is to be truly considered bullish, it needs to close below 38. Without that, volatility remains high and does not bode well for the overall market.

In summary, when the market failed to break down through 810 last week, that was a major victory for the bulls. But now, they are hard-pressed to do much with it. We expect the January month-end bullishness to help the upside case in the short term, but after that, the bears may have their way again. In truth, only a breakout above 930 would prove the bullish case (that would re-establish a series of higher highs and higher lows). A breakdown below 810 would be very bearish and would surely lead to new lows.
Lawrence G. McMillan is the author of two best selling books on options, including Options as a Strategic Investment, recognized as essential resources for any serious option trader's library.
|