| Is The VIX At A Critical Juncture? |
| By Price Headley |
Published
02/3/2009
|
Currency , Futures , Options , Stocks
|
Unrated
|
|
|
|
Is The VIX At A Critical Juncture?
The CBOE Market Volatility Index (VIX) sits at a critical technical juncture. For those unfamiliar with the VIX, this index is an up-to-the-minute market estimate of the expected volatility based on the pricing f the S&P 500 Index (SPX) options. More specifically, the VIX is calculated off the nearby and second nearby month of the SPX options. Typically, the VIX's price action is inversely related to the price action of the S&P 500 Index.
The VIX is a widely followed indicator that is also known as the fear barometer. Spikes and elevated levels in the VIX reflect high levels of fear while significant drops and suppressed levels are signs of optimism. While the VIX is currently not near its highs or lows, the fear index is at a noteworthy technical level.
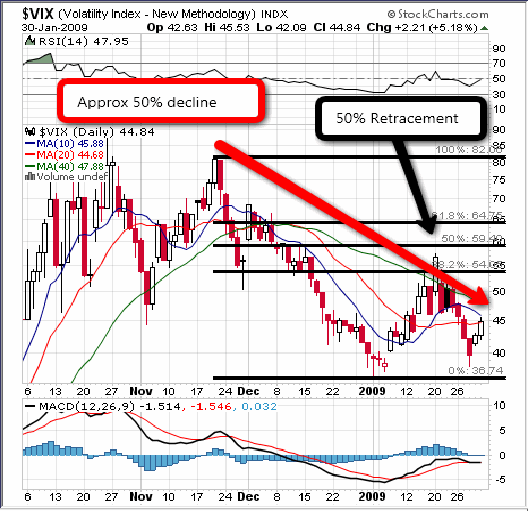
Below is a daily graph of the VIX that shows the price action from early October though January 30th. Three points standout from the graph.
VIX Daily Chart

First, with the VIX at 44.84 (as of Friday's close), the fear barometer has declined approximately 50% since its peak on November 19th. It is noteworthy that the VIX has not been able to make further inroads below the 40 region.
Second, we see a double-bottom formation taking shape at the January 2nd and January 28th lows. This region looks particularly important for SPX bulls to see be broken in the next couple of weeks. Otherwise, we could see the VIX run back to the high 50's, which is covered by the next point.
Third, from the peak of November 19th to the low on January 2nd and the subsequent rebound to 57, was approximately a 50% retracement from the high and low mark. With the double bottom pattern developing, a VIX rally to the high 50's could be a scenario in the next couple of weeks.
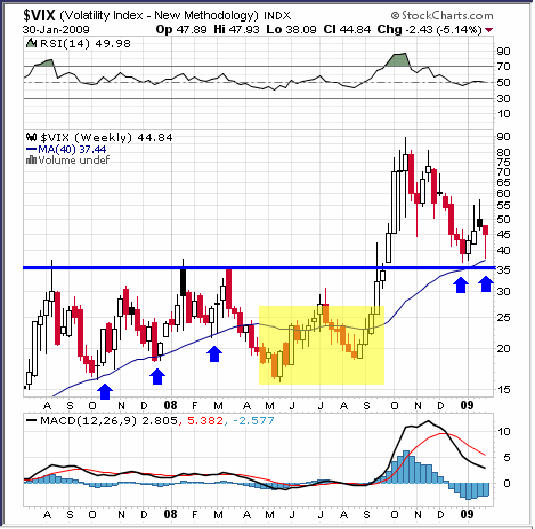
Turning to the weekly graph of the VIX, we see a couple of more interesting technical patterns. First, the 40-week moving average (approximately 200-day moving average), has been a critical trendline for the last couple of years. The blue trendline has been supportive of the 200-day moving average (blue arrows) throughout late 2007 and early 2008. Unfortunately, this trendline failed in its relevance from May through September (yellow blocked area). Though, the long-term moving average appears to be coming back in its importance. In the first few weeks of 2009, this trendline has been containing the drawdowns in the VIX. Second, the blue horizontal line at the 35 region is significant as an area of support. This region marked the peaks in the VIX throughout the second half of 2007 and early 2008. In the past month, the 35-37 area has been key support for the VIX.
VIX Weekly Chart

Putting all of this together, investors have to be concerned with the preponderance of technical evidence that the VIX could very likely make another bullish run. Supporting a potential VIX upleg includes the double-bottom pattern, the 200-day moving average, price support at 35, and the 50% decline of the VIX. For investors, this would coincide with more SPX declines ahead. Bullish investors would prefer to see the VIX to reverse the current trend and have this fear index break below its 200-day moving average, penetrate the price support (35-37 region), and pierce the double -bottom pattern. This seems like a tall order at the present moment.
Price Headley is the founder and chief analyst of BigTrends.com.
|
|