| Corcoran Technical Trading Patterns For February 4 |
| By Clive Corcoran |
Published
02/4/2009
|
Stocks
|
Unrated
|
|
|
|
Corcoran Technical Trading Patterns For February 4
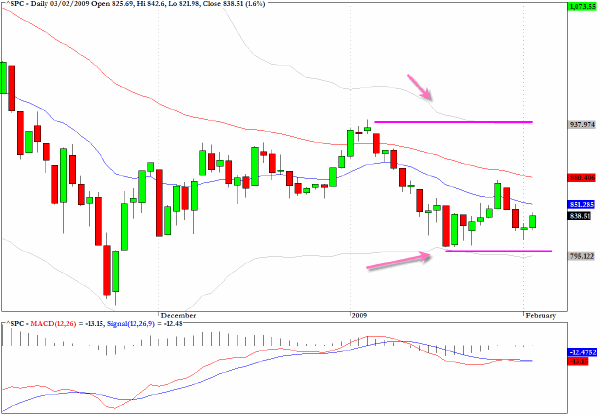
The trading range regime continues and is clearly demonstrated in the chart below for the S&P 500 (SPX). Observe the two grey lines on the chart on the right hand side - these represent the upper and lower volatility (Bollinger) bands based on a 40-day simple moving average. The upper level corresponds exactly with the upper price of the trading range around 935 and the lower band is more or less at 795 which represents the lower level.
In other words the market has exerted an enormous amount of energy and adrenalin over the last two months and has essentially gone nowhere. There is a tendency to keep believing that there will be some breakout from this range but given the recent behavior there is perhaps a greater probability that, to paraphrase a well-known saying in French, the more things change the more they stay the same.
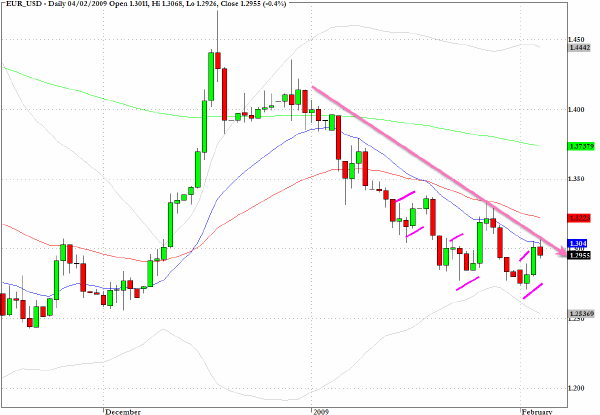
Attention will focus on the Euro currency over the next 24 hours with an ECB rate decision imminent. The technical condition as discussed here recently is pointing towards another mini-bear flag pattern evolving with a further decline probable.
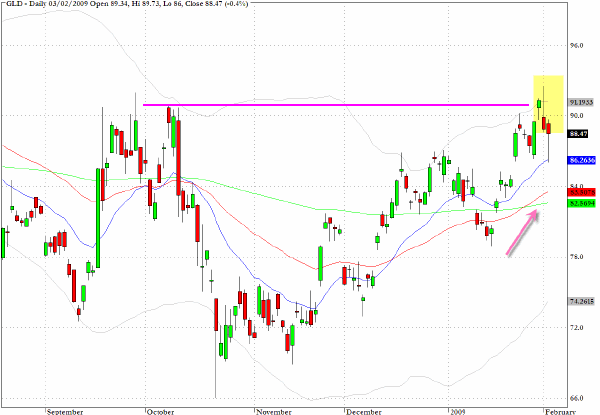
The ETF for Gold, GLD, may have to regroup at the point of convergence of two key moving averages before penetrating the overhead resistance seen on the chart.
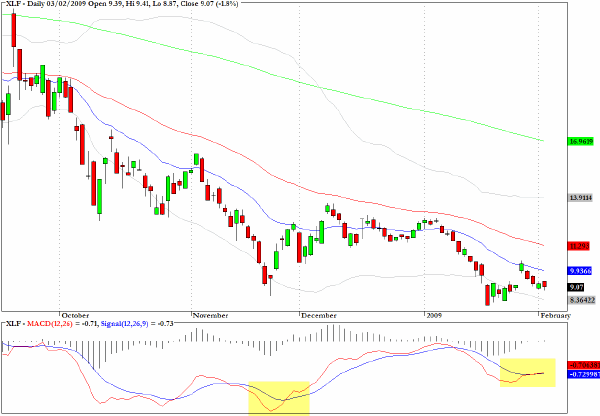
XLF has been treading water since the burst of enthusiasm last week when the on again/off again idea of removing the non-valuable assets from the bank's balance sheets spread some enthusiasm for the sector - or was it some anxiety on the part of those who have been comfortably short the sector for a very long time.
The positive MACD divergence still lends plausibility to the notion a sustainable bottom may be forming.
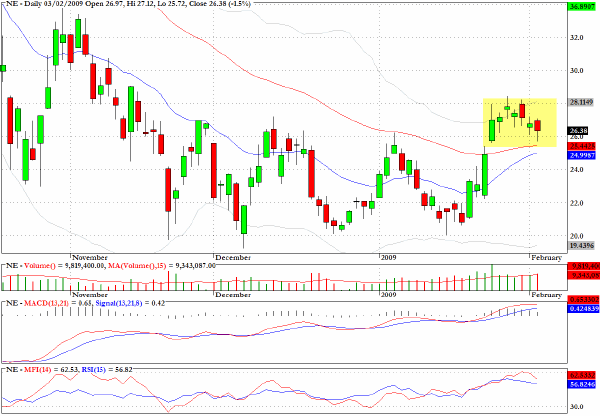
There is a bullish looking flag formation on the chart for Noble (NE).
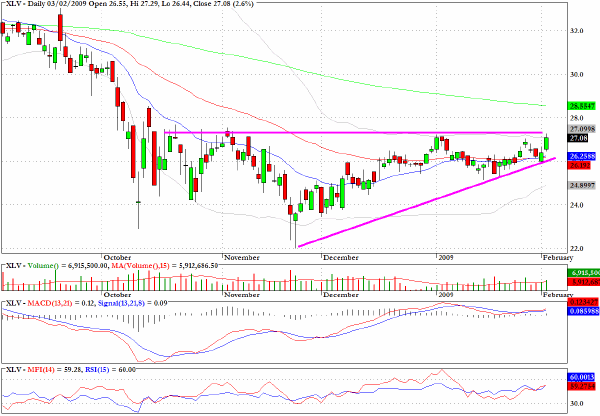
What is appealing on the chart for Health Care Select Sector SPDR, XLV, is yesterday's peek above an upward wedge pattern on above average volume. But the presence of the 200-day EMA may suggest that the trade could hit resistance in today's session.
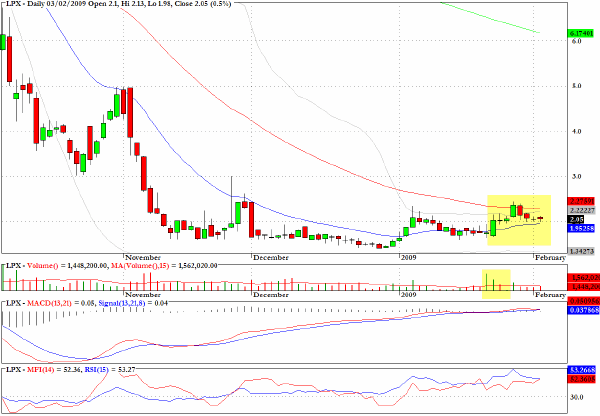
Louisiana Pacific (LPX) could be ready to break away from a basing pattern.
Clive Corcoran is the publisher of TradeWithForm.com, which provides daily analysis and commentary on the US stock market. He specializes in market neutral investing and and is currently working on a book about the benefits of trading with long/short strategies, which is scheduled for publication later this year.
Disclaimer
The purpose of this article is to offer you the chance to review the trading methodology, risk reduction strategies and portfolio construction techniques described at tradewithform.com. There is no guarantee that the trading strategies advocated will be profitable. Moreover, there is a risk that following these strategies will lead to loss of capital. Past results are no guarantee of future results. Trading stocks and CFD's can yield large rewards, but also has large potential risks. Trading with leverage can be especially risky. You should be fully aware of the risks of trading in the capital markets. You are strongly advised not to trade with capital.
|