| Corcoran Technical Trading Patterns For February 9 |
| By Clive Corcoran |
Published
02/9/2009
|
Stocks
|
Unrated
|
|
|
|
Corcoran Technical Trading Patterns For February 9
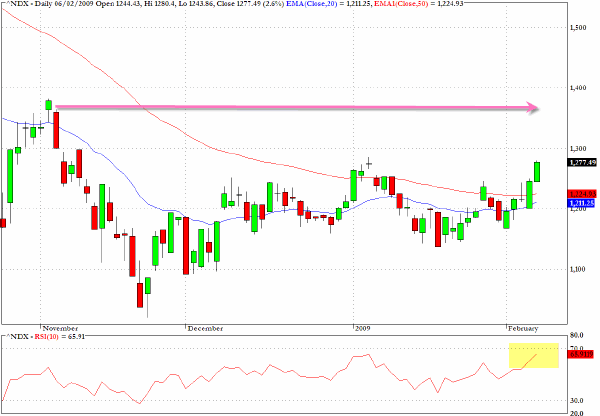
There were several leading technical indicators at work during the earlier part of last week which were suggesting that the market was preparing to rally. One of them which I discussed a couple of times was the new leadership being shown by the Nasdaq 100 stocks (^NDX). In Friday's trading this index once again showed the way forward with another 2.6% gain.
There are two areas of resistance to overcome - one at the 1300 level which is quite likely to be tested today and another at the reaction intraday high from November 4 in the area of 1380.
One warning signal which is flashing is the RSI reading which is approaching levels where selling should emerge if the range bound rally conditions are still in effect.
It is conceivable that we can break out of that range this week as the market digests the Geithner announcements.
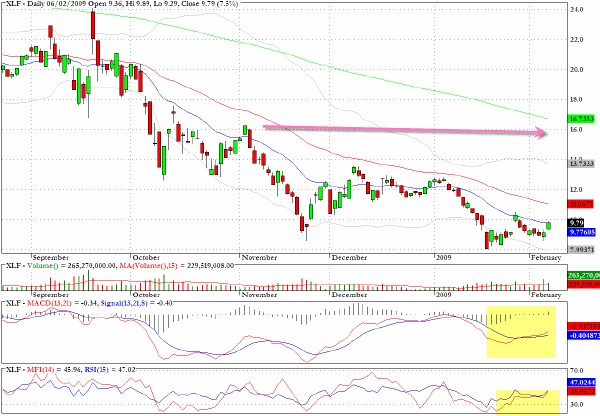
Several times recently I pointed to the developing positive MACD divergence on the charts for the banks and financials in general and also alluded to the flag formation that was developing for XLF. Friday's rally was not unexpected and there is mounting evidence that the tide may be turning for the financials.
There is a slight warning however which is that the charts for the banks and financials had been discounting a financial Armageddon - which now seems to have passed - but have the charts for other equities discounted enough of a significantly deteriorating backdrop for non-financials?
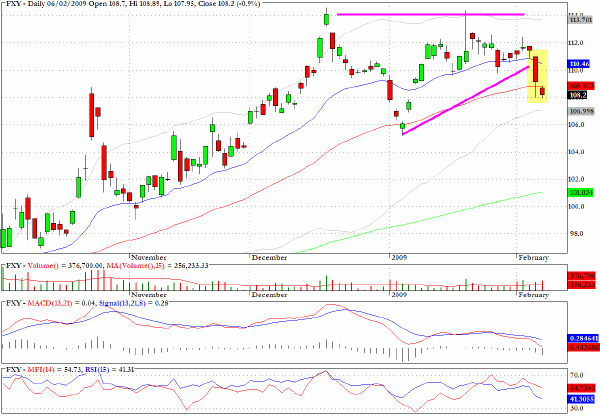
The Japanese yen is looking like a sell after showing topping out signs as suggested here a couple of weeks ago. Playing the short side can be achieved by using the exchange traded fund FXY.
There is a very interesting article in The New York Times dated February 6 by Floyd Norris.
The author takes a long-term look at the S&P 500 and considers some of the least rewarding time periods to have been invested in the market - including the 1930's and also the 1970's and comes to the following rather startling conclusion.
There has never seen a 10-year stretch as bad as the one that ended last month. Over the 10 years through January, an investor holding the stocks in the S.& P.’s 500-stock index, and reinvesting the dividends, would have lost about 5.1 percent a year after adjusting for inflation.
For years the supposedly smart investment gurus - the wise men of finance - along with the large mutual fund companies like Fidelity as well as the Personal Finance pages of the broadsheets were telling us that the right way to approach investment was Buy and Hold.
One should shun such advice from the financial “professionals” and while at it one might just as well forget the SEC, FSA, government regulators etc. The stark truth is that more than ever we are all on our own and need to retrain our instincts in order to survive and successfully navigate through the financial labyrinth of smoke and mirrors that will separate you from your wealth.
A number of commentators believe that a new bullish move is beginning and are pointing to several supportive factors. One somewhat esoteric indicator is the Baltic Dry Freight Index, a futures contract which is traded in London and which reflects the anticipated future demand for shipping dry goods (i.e. not oil). The BDI has jumped dramatically over the last several sessions and in harmony with this has been evidence of capital flows returning to Chinese equities.
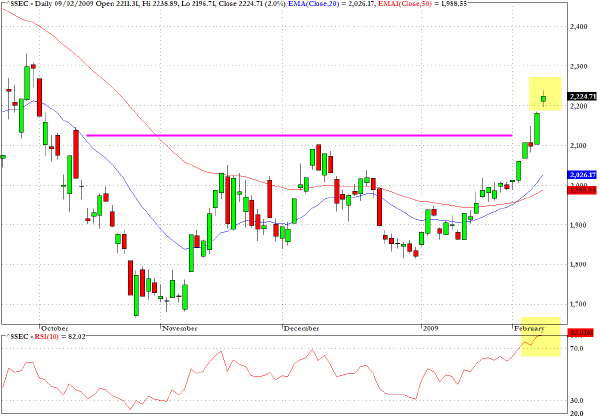
The Shanghai Exchange (^SSEC) continued to rally in Monday's trading but the small range session near to a point of chart resistance and with an RSI reading in the 80's suggests that this may not be a good time to chase this trade.
On a pullback the exchange traded fund FXI could be attractive on the long side. Just how far this rally can go is very uncertain but the market was extremely oversold and with a greater appetite for equities beginning to emerge there is plenty of scope for a sustained and sharp rally in this geographical sector.
Here is my comment from last Wednesday's column:
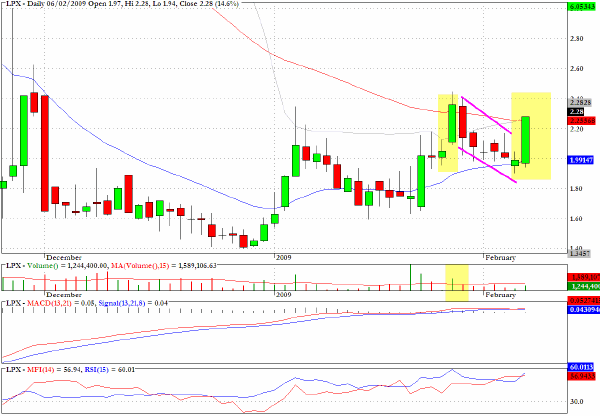
Louisiana Pacific (LPX) could be ready to break away from a basing pattern.
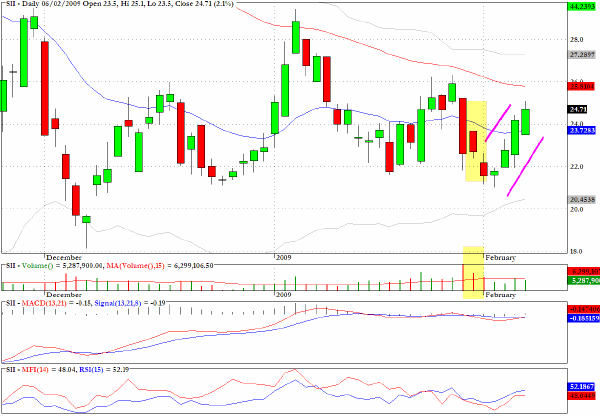
Smith International (SII) looks vulnerable at the top of an ascending pullback channel.
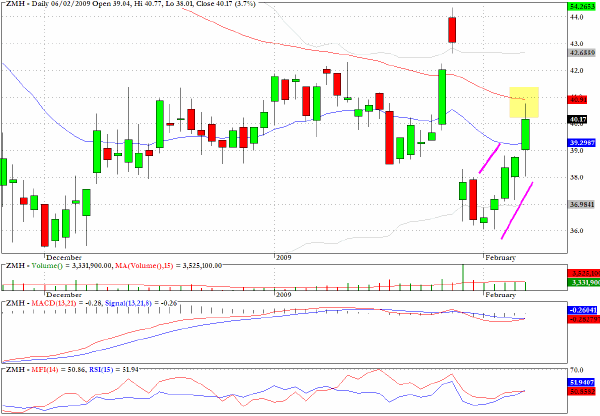
The chart for Zimmer Holdings (ZMH) has similar concerns to that for SII.
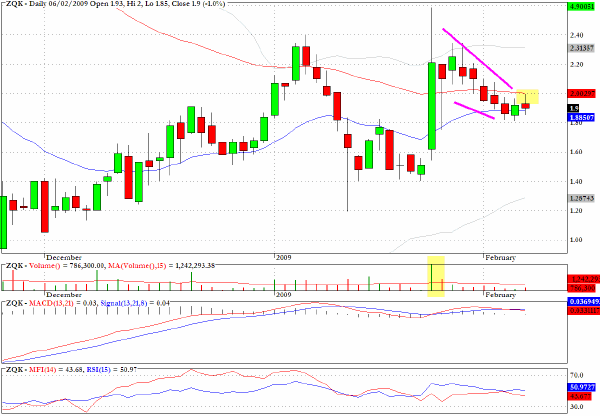
Quicksilver (ZQK) has a bullish pullback channel and has reached likely support where two moving averages have converged.
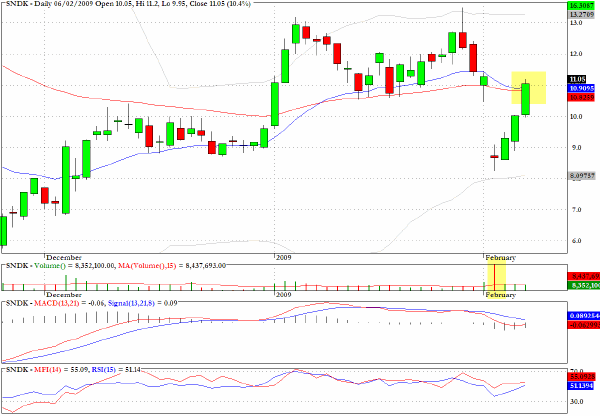
Sandisk (SNDK) has risen sharply over the last three sessions on light volume following the heavy volume sell off earlier last week.
Clive Corcoran is the publisher of TradeWithForm.com, which provides daily analysis and commentary on the US stock market. He specializes in market neutral investing and and is currently working on a book about the benefits of trading with long/short strategies, which is scheduled for publication later this year.
Disclaimer
The purpose of this article is to offer you the chance to review the trading methodology, risk reduction strategies and portfolio construction techniques described at tradewithform.com. There is no guarantee that the trading strategies advocated will be profitable. Moreover, there is a risk that following these strategies will lead to loss of capital. Past results are no guarantee of future results. Trading stocks and CFD's can yield large rewards, but also has large potential risks. Trading with leverage can be especially risky. You should be fully aware of the risks of trading in the capital markets. You are strongly advised not to trade with capital.
|