| Obama's $819 Billion Economic Stimulus Plan |
| By Kathy Lien |
Published
02/9/2009
|
Currency , Futures , Options , Stocks
|
Unrated
|
|
|
|
Obama's $819 Billion Economic Stimulus Plan
This week, the currency and equity markets will be focused on President Obama’s $819B Economic Stimulus Plan. So I think it is important to take a look at how Obama’s plan is structured and the Washington Post does a fantastic job of breaking the stimulus package down. The markets aren’t too happy with the fact that Geithner delayed announced the Financial Rescue Package to Tuesday at 11am ET The official reason for the delay is because Geithner wants to focus on passing the stimulus bill. But when the Bank Rescue plan is announced, it could trigger some optimism across the financial markets (click chart to zoom in).
The Senate could vote as early as Tuesday after which it will probably be debated between House and Senate leaders. If things go well, Obama could have the bill ready to sign by next week. The President will also be holding his first press conference this evening at 8pm ET.
Predicting Canadian Employment Numbers
I am kicking myself for not posting this last night, but I’ve been swapped with preparing for the NY Traders Expo and writing my non-farm payrolls preview.
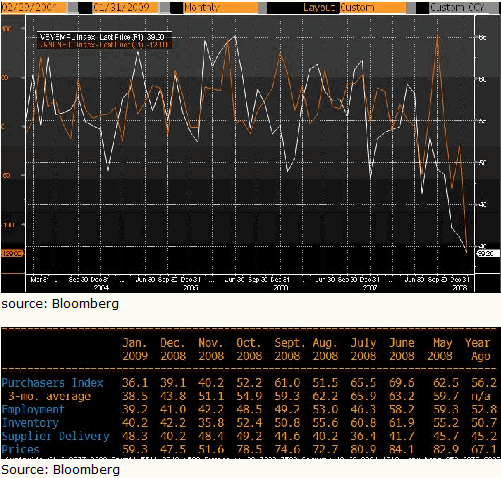
Yesterday, I wanted to show you this chart of the correlation between the employment component of IVEY PMI (white line) and Canadian employment (orange line) and argue that Canadian employment will be very weak, favoring a move higher in USD/CAD. In the second chart, you can see that the employment component of IVEY PMI dropped from 41.0 to 39.2 in Jan. Of course that has already happened and not all that useful for trading purposes today. Canadian employment dropped 129k in January which is the equivalent of a million jobs in the US.

However, i still think its important to share the information as an intellectual exercise because the strong correlation indicates that it is tradeable next month. My edge has always been in predicting and trading ahead of economic data.
Kathy Lien is Director of Currency Research at GFT, and runs KathyLien.com.
|