| Corcoran Technical Trading Patterns For February 10 |
| By Clive Corcoran |
Published
02/10/2009
|
Stocks
|
Unrated
|
|
|
|
Corcoran Technical Trading Patterns For February 10
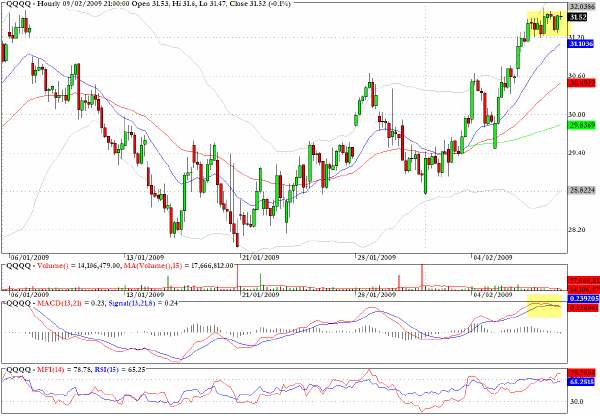
The period covered in the hourly chart below for the Nasdaq 100 proxy, QQQQ, shows almost all of the trading for the year so far.
Clearly visible is the resistance that the index encountered yesterday at the highs seen on January 6. Reticence to really challenge that level ahead of today's announcements was a good excuse for the index to stall
As suggested yesterday, the trading over the last several weeks has been extremely range bound and the path of least resistance for the tech stocks, at this point, would be down unless new proposals provide a catalyst to propel equities above the upper end of their recent range.

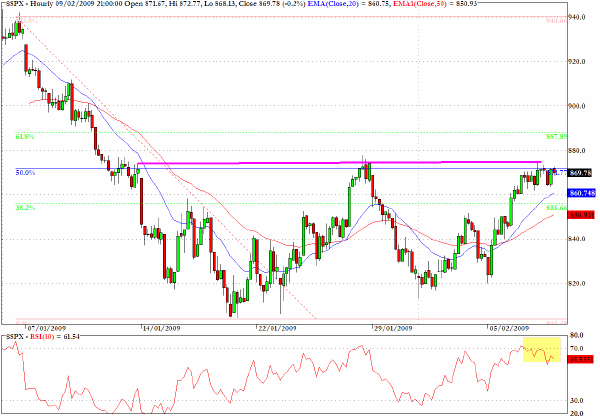
The hourly chart for the S&P 500 cash index shows how resistance was encountered yesterday, but, as can be seen from the Fibonacci grid, the index still has to make it through the 50% retracement level from the early January high and the January 20 low.
I would suggest that we are at a juncture where many market participants are expecting an upward breakout, but also where one has to imagine that are a number of bearish traders looking to fade any quick enthusiasm for what might be seen as a final breakthrough in resolving the banking mess.
The real test for this index would be to see a rather sharp reversal to the upside, if the 850 level is successfully re-tested in coming sessions.

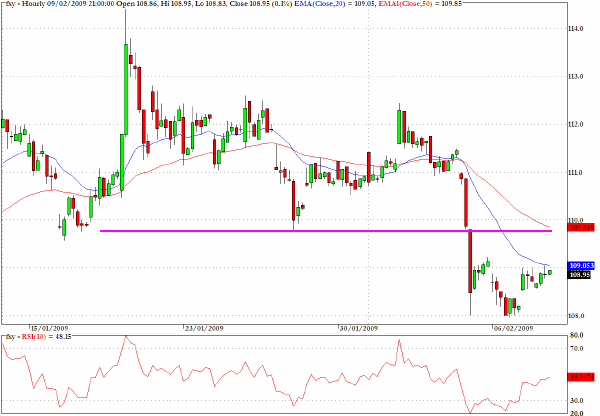
The hourly chart for sector fund which tracks the Japanese yen reveals two long red candlesticks during yesterday’s session and a retracement pattern that began before the close of trading yesterday.
Judging from the overnight interbank market there could be a gap down open in today’s session and the outlook here is bearish.
On any rally back towards the 110 level would provide a good entry point on the short side.

Clive Corcoran is the publisher of TradeWithForm.com, which provides daily analysis and commentary on the US stock market. He specializes in market neutral investing and and is currently working on a book about the benefits of trading with long/short strategies, which is scheduled for publication later this year.
Disclaimer
The purpose of this article is to offer you the chance to review the trading methodology, risk reduction strategies and portfolio construction techniques described at tradewithform.com. There is no guarantee that the trading strategies advocated will be profitable. Moreover, there is a risk that following these strategies will lead to loss of capital. Past results are no guarantee of future results. Trading stocks and CFD's can yield large rewards, but also has large potential risks. Trading with leverage can be especially risky. You should be fully aware of the risks of trading in the capital markets. You are strongly advised not to trade with capital.
|