Today we'd like to answer a few questions with one, complete response, since they were all related to one another. Specifically, we want to address some of the responses to last Thursday's column. In that column, we raised the issue that sector diversity can have a downside, and that it can pay to have a focused (concentrated) portfolio, if you're overweighted in the right things. As you may have expected, some people agreed, and some didn't. Most of the questions, though, actually centered around the "how to" of the strategy. So today, I'd like to respond to both of the camps.
I think this reader asked it best and most effectively:
"Your chart on the best performing sector report card for the year shows what has happened. How can we identify the top 4-5 sectors-to-be for the next 9 months? Should we look at certain ETF's that represent the different sectors and look for technical breakouts? What are some clues? Thanks for taking my question."
Well, first, thanks for asking the question - these are usually the most interesting pieces to write. The reader has a very valid point. To make the most of sector rotation analysis, you really have to know what's likely to happen six months from now, and not what happened six months ago. As far as sectors go, there are a lot of ways to spot shifts in the hot and cold sectors.
One of our favorite ways to get a grip on that type of sector dynamic is the analysis we recently added to our weekly Sector Spotlight column. In simplest terms, we're just looking for sector rotation on a short-term basis. By "rotation", we just mean we want to see which sectors are gaining ground, and which one are losing ground. To do that, all we really need to know is how each sector has performed over two distinct timeframes. So, all we do is calculate the returns for the major sectors over the last month, and compare that to the returns for the month before that. Any reversals (good or bad), and any strong or sustained trends, become very apparent very quickly. For an example of this analysis, just click here. Based on that analysis alone, you would have known that utilities and energy were poised for gains, and that the discretionary (cyclical) stocks were headed lower.....all because of how these sectors had performed recently in relation to how they had performed not-so-recently.
But there's another way that we like just as well, and it doesn't require any math. It does, however, require some charting software and a computer screen. In one of our software packages, we've set up a "one screen" glance of all the major sectors. Ours is based on weekly charts, and the only moving average we've plotted is the 200 day line. To really get a feel for how the sectors are doing, this is a very easy tool to use because it allows us to compare all the charts to one another in a matter of seconds. For a glimpse of that screen, click here: http://bigtrends.com/images/100305sectorrotationscreen.gif.
There are other ways to do the same thing, but the concept is always the same. All you need to know is what's new with a sector, and how does that compare with the other sectors. So to answer the reader's question, look for new breakouts that occur by sector, and/or look for moving average crossovers by sector. The strongest sectors will breakout before the others, and the weakest sectors will breakdown before the others. The biggest challenge is keeping your finger on all of them at the same time. You'll also need to adjust moving averages and timeframes to suit your style, but that's easy to do once you've got the analysis tools in place.
So the next question is, does it work? Our answer is a resounding yes! So, the methodology works, but let's take a look at exactly how we applied it.
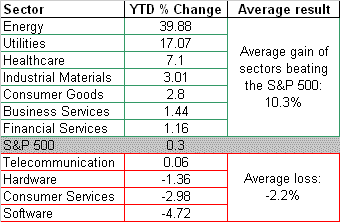
As a quick reminder, we published this sector performance table on Thursday. It's pretty clear from this information where the sweet spot was this year - in energy stocks.
Sector Performance - Year-to-Date

Needless to say, that's the sector we want to overweight. But like the reader pointed out, you need to know this before it happens - not after.
As in all cases, there can be false starts with sector moves too. But with a thorough analysis like the one we do, the fakeouts are rare. Second, there's a difference between a concentrated portfolio and a reckless one. We'll still never put our entire portfolio into one sector or one stock. Our maximum exposure to one position is going to be 10 percent, at the most. Just be smart (and disciplined) about how you use the strategy.
A new concept? For the "traders" it may or may not be. But for "investors", I'm sure this idea is completely at odds with the advice you've been getting for a long, long time. I'm all for getting qualified advice, but as a consumer, you deserve to hear the other side of the story. More often than brokers and advisors are willing to acknowledge, they're recommending perfect diversification not because it's the wise thing to do, but because they may not know exactly what to do with your portfolio. The solution to their shortcoming is a strategy that appears very logical, and is virtually guaranteed to not underperform the market. Unfortunately, it may or may not actually make you any real money. Just some food for thought
Price Headley is the founder and chief analyst of BigTrends.com.