| Corcoran Technical Trading Patterns For February 19 |
| By Clive Corcoran |
Published
02/19/2009
|
Stocks
|
Unrated
|
|
|
|
Corcoran Technical Trading Patterns For February 19
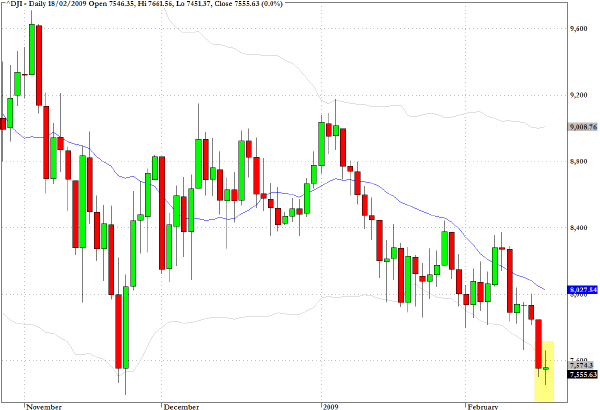
The Dow Jones Industrials Average (DJIA) registered an almost perfectly formed doji star pattern with an open and close just a few ticks away from Tuesday's close. Such a pattern can signify an inflection point, especially in the neighborhood of a strategically significant level.
Beneath the surface in yesterday's trading there was a marked deterioration in several sectors of the market. Of the 800 or so stocks that I actively monitor, only ten moved up by five percent or more yesterday whereas 52 moved down by five percent or more. Utilities and transports continued their decline and there is precious little evidence that institutions are buying at the current levels.
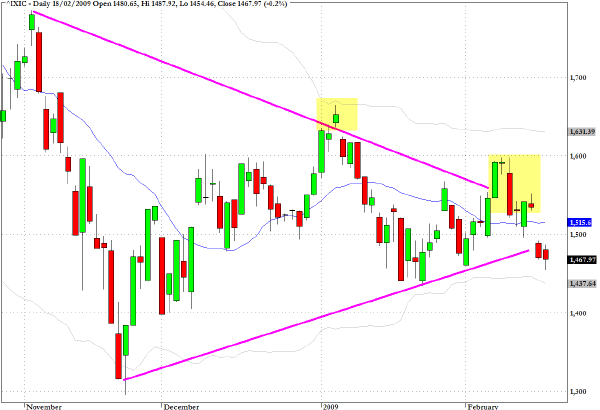
I have not reviewed the Nasdaq Composite index (IXIC) for some time. The two areas highlighted in yellow on the chart reveal two attempts to break out to the upside from the pronounced triangular formation. Both efforts were short-lived and we now confront a potential break down.
Far more than the charts for the S&P 500 and the DJIA, the chart below suggests that a trading range dynamic is still in evidence for this index. Further weakness in the near term and a break below the 1440 level - the closing low on January 20 - would strengthen my opinion that the bullish camp is starting to lose heart at current levels.
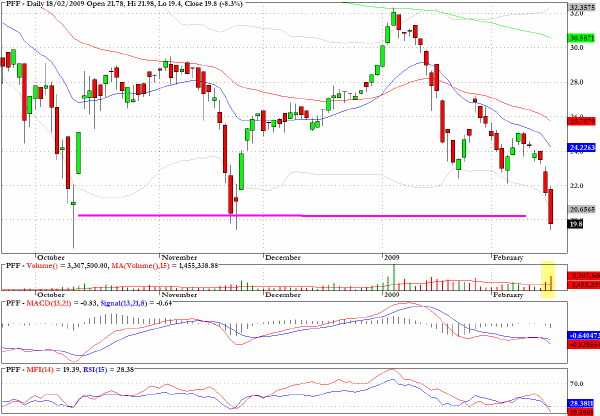
PFF, which tracks the S&P Preferred Stock Index, provides an insight into the appetite which institutions have for the less visibly traded capital structure of the banks and other large corporations.
It is one of the barometers that I use periodically for assessing, at least at a fairly simple level, the risk aversion/speculation matrix.
The closing low yesterday exceeded the prior lows from October and November and this is another indication that the market is not being perceived as offering compelling opportunities to many large institutional investors.
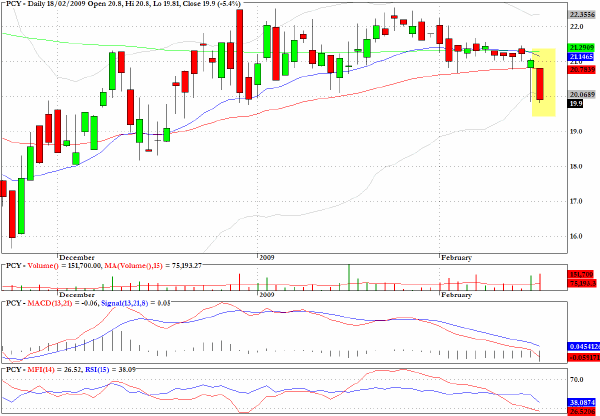
PCY, the sector fund which tracks Emerging Markets Sovereign Debt, slipped below key moving average support on a spike in volume.
Credit default swaps for many sovereign credits are widening, and with the plight of the old Soviet bloc countries simmering away in the background, this looks like a good sector to be short in coming sessions.
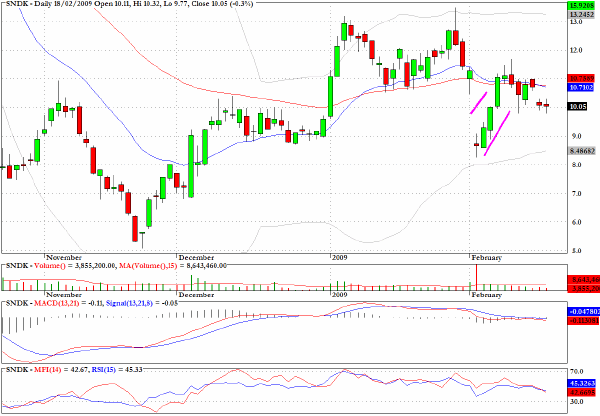
The pullback channel for Sandisk (SNDK) has stalled and the two consecutive tiny doji stars on modest volume could be pointing to a re-emergence of the downward pressure which surfaced at the beginning of February.
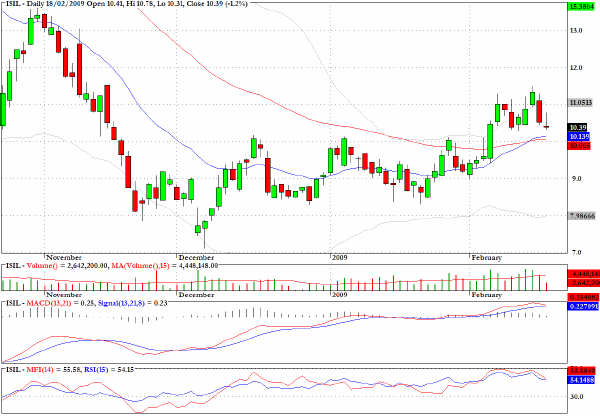
Intersil (ISIL) has a constructive-looking pattern on the long side.
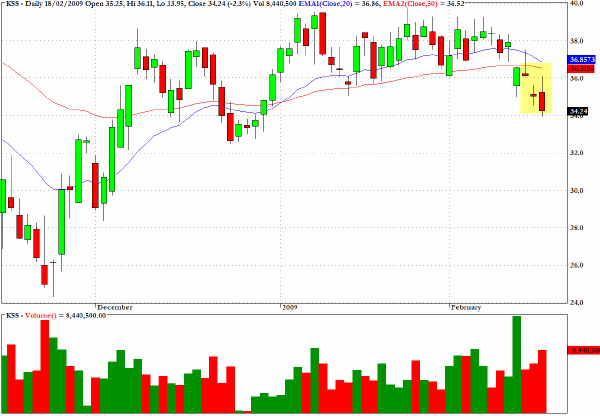
Kohl's Corporation (KSS) has dropped below two key moving averages and, although another effort to pull back towards the $36 level is conceivable, there is a clear pattern of topping out at the $38 level in place.
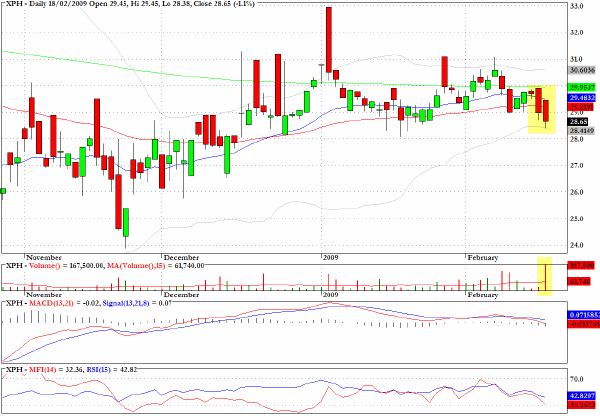
A surge in selling emerged yesterday, in conjunction with a technically weak pattern following the recent break below all three key moving averages, on the chart for XPH which is an exchange traded fund tracking the pharmaceuticals.
Clive Corcoran is the publisher of TradeWithForm.com, which provides daily analysis and commentary on the US stock market. He specializes in market neutral investing and and is currently working on a book about the benefits of trading with long/short strategies, which is scheduled for publication later this year.
Disclaimer
The purpose of this article is to offer you the chance to review the trading methodology, risk reduction strategies and portfolio construction techniques described at tradewithform.com. There is no guarantee that the trading strategies advocated will be profitable. Moreover, there is a risk that following these strategies will lead to loss of capital. Past results are no guarantee of future results. Trading stocks and CFD's can yield large rewards, but also has large potential risks. Trading with leverage can be especially risky. You should be fully aware of the risks of trading in the capital markets. You are strongly advised not to trade with capital.
|