| Dow Monthly Chart Points To 4500? |
| By Mike Paulenoff |
Published
02/19/2009
|
Stocks
|
Unrated
|
|
|
|
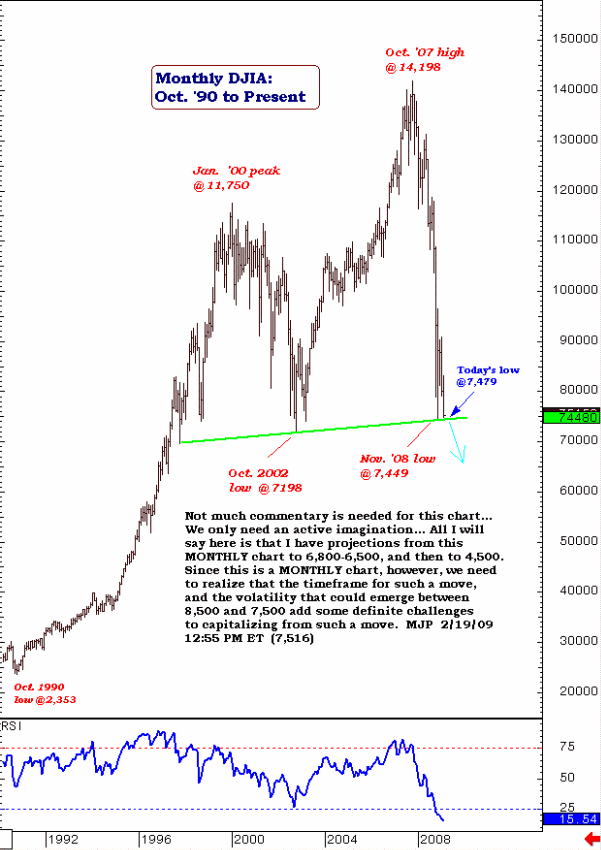
Dow Monthly Chart Points To 4500?
Not much commentary is needed when viewing the monthly chart of the Dow. We only need an active imagination. All I will say here is that I have projections from this monthly chart to 6800-6500 and then to 4500. Since this is a monthly chart, however, we need to realize that the timeframe for such a move, and the volatility that could emerge between 8500 and 7500, add some definite challenges to capitalizing from such a move in trading the Dow Diamonds Trust (NYSE: DIA) or the ultra long or short Dow ETF instruments.

Mike Paulenoff is a 26-year veteran of the financial markets and author of MPTrader.com, a real-time diary of his technical chart analysis and trading alerts on all major markets. For more of Mike Paulenoff, sign up for a free 15-Day trial to his MPTrader Diary by clicking here.
|