| Corcoran Technical Trading Patterns For February 20 |
| By Clive Corcoran |
Published
02/20/2009
|
Stocks
|
Unrated
|
|
|
|
Corcoran Technical Trading Patterns For February 20
The current market action is giving an even subtler dimension to the notion of a slow motion crash. The DJIA closed at its lowest level in more than six years and the financials continue to get pummeled, but there seems to be a rather stoical and mild-mannered response to it all.
Part of the reason has to do with the way in which the Dow Jones is calculated.
The Dow is a price-weighted index where the higher the stock price, the more it affects the index's value. As many financial companies have plunged in value, the Dow is littered with sub-$10 stocks that have little impact. Consider that Bank of America (BAC), Alcoa (AA), Citigroup (C), General Motors (GM), and General Electric (GE) have a combined weighting of 2.9%. If all five were to go bankrupt the U.S. economy would be devastated, yet the Dow would fall only 220 points.
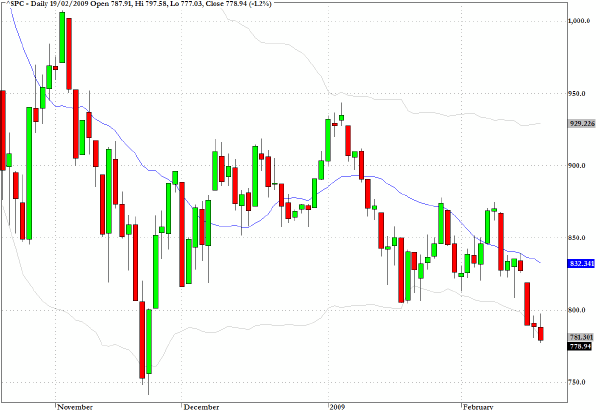
The S&P 500, which is market cap weighted, is not quite at multi-year lows but a rendezvous with 750 looks almost inevitable. If that breaks I suspect that we could be looking at 680 in a hurry.
Many learned analysts from a more fundamental perspective are making cases for 600 or thereabouts on the S&P 500 based on P/E ratios, but the enigma at the moment is trying to make any kind of convincing case as to what the E part of the formula is going to be this year.

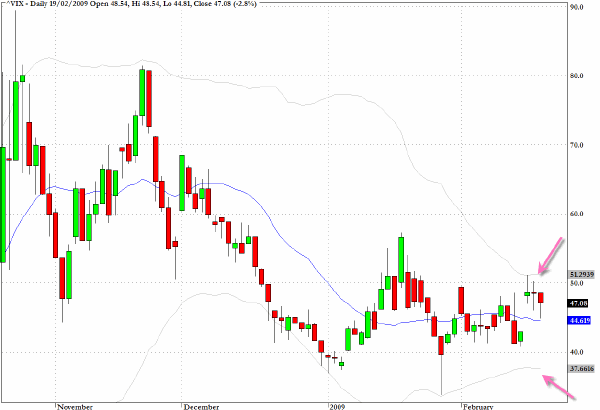
The action in the CBOE Volatility Index (VIX) suggests that traders are not overwhelmingly concerned about the precarious state of major indices and that a new possibly severe leg down may be just around the corner.
I would point to the fact that the volatility (Bollinger) bands on the index itself are constricting which suggests that we may be headed for a breakout move - and at this stage it is hard to believe that that would be pointing to lower volatility ahead.

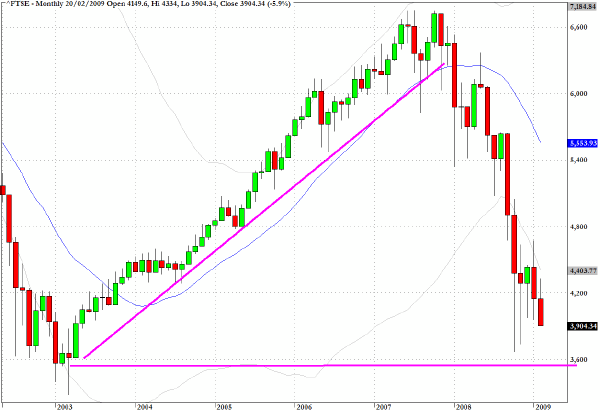
The UK's FTSE has dropped more than 2.5% so far in London trading, and as the long-term monthly chart suggests, the lows from last fall as well as the lows seen in March 2003 seem to be back on the radar.

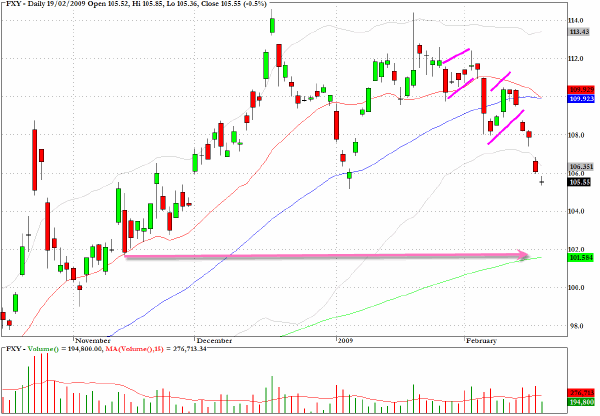
I am particularly pleased with the call I made some weeks ago on pending weakness for the Japanese yen. At the time there were the beginnings of a topping pattern in the technicals but all of the commentators were still insisting that the Japanese currency was part of the safe haven matrix. Meanwhile the habitual dollar bears were proselytizing about the risks to the greenback and some were urging investors to seek out the relative safety of the yen.
It seems almost certain that the Japanese central bank is partly responsible for the drop as it tries to engineer a more favorable exchange rate for their exports. If that is so, they will probably be targeting considerably lower levels.
The point marked by the arrow which coincides with the 200 EMA seems feasible in the intermediate term.

Clive Corcoran is the publisher of TradeWithForm.com, which provides daily analysis and commentary on the US stock market. He specializes in market neutral investing and and is currently working on a book about the benefits of trading with long/short strategies, which is scheduled for publication later this year.
Disclaimer
The purpose of this article is to offer you the chance to review the trading methodology, risk reduction strategies and portfolio construction techniques described at tradewithform.com. There is no guarantee that the trading strategies advocated will be profitable. Moreover, there is a risk that following these strategies will lead to loss of capital. Past results are no guarantee of future results. Trading stocks and CFD's can yield large rewards, but also has large potential risks. Trading with leverage can be especially risky. You should be fully aware of the risks of trading in the capital markets. You are strongly advised not to trade with capital.
|