|
The Wagner Daily ETF Report For February 20
Opening near the top of the previous day's range, stocks got off to a positive start yesterday morning, but the bears quickly took control. By mid-day, the morning gains had evaporated. By the closing bell, the major indices had suffered another round of losses. The S&P 500 and Dow Jones Industrial Average both fell 1.2%, as the Nasdaq Composite slid 1.7%. The small-cap Russell 2000 and S&P Midcap 400 indices shed 1.5% and 1.6% respectively. The main stock market indexes finished near their worst levels of the day.
Total volume in the NYSE ticked 3% higher, while volume in the Nasdaq registered 3% lighter than the previous day's level. If the broad market was still in an intermediate-term uptrend, the S&P 500's loss on higher volume would have represented a bearish "distribution day." However, when the stock market is already in correction mode, counting the days of higher volume losses is irrelevant. Rather, we now want to look for sessions of higher volume gains (aka "accumulation days") as an early signal to the next bullish trend reversal.
When the major indices broke support of their intermediate-term uptrend lines on February 17, we said the overall market was now back in "correction mode," which would likely cause the main stock market indexes to test their November 2008 lows. Overnight, the financial media was abuzz about the Dow closing at a new multi-year low, but this should not have been shocking news to our readers. Indeed, the Dow Jones Industrial Average violated its November 2008 closing low, finishing yesterday at its lowest level since October 2002. But even though this is significant from a technical standpoint, don't get too wound up about the stock market now definitively heading for another leg down. First, realize the Dow has only "undercut" its November 2008 closing low by one percent. Commonly, an index will probe through a major level of support or resistance by one or two percent, triggering a lot of stops in the process, then snap back into the prior range. Simply put, the Dow has not yet broken its November low by a wide enough margin for the breakdown to be convincing. Further, it's notable that the S&P 500 and Nasdaq Composite still remain well above their November 2008 lows. Only the Dow, a narrow index of just thirty stocks, is in new low territory.
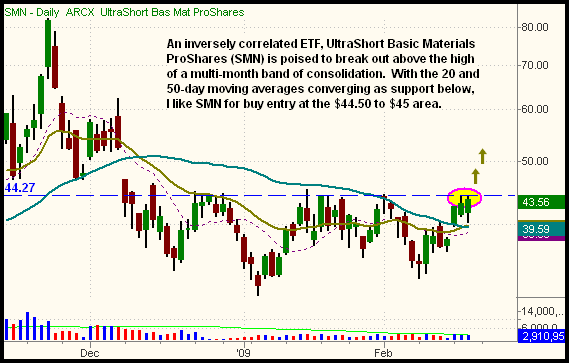
Since that February 17 breakdown in the broad market, we've been looking for potential ETF short setups and/or inversely correlated ETF buy entries. UltraShort Basic Materials ProShares (SMN), which moves in the opposite direction of the underlying sector, is one such bearish setup. Its daily chart is shown below:

When the major indices fell below support of their uptrend lines on February 17, SMN moved back above its 50-day moving average (the teal line). In the two days that followed, SMN consolidated in a tight range, above that 50-day moving average, while the 20-day exponential moving average is about to cross up through the 50-day. If SMN moves above its two-day high, it will correlate to a breakout above the high of a multi-month base of consolidation. That would trigger our buy entry, around the $44.50 to $45 area. To protect against a failed breakout, a protective stop would subsequently be placed below the February 19 low, as well as the 20/50-day moving average convergence.
Since the market is in "correction mode," we do not advocate being heavily long right now. Still, it's not a bad idea to be positioned on both sides of the market; long an ETF or two in sectors with relative strength (healthcare, gold), and short ETFs with relative weakness (basic materials). If you're not comfortable with short selling for whatever reason, then a primarily cash position is the way to go.
Open ETF positions:
Long - IBB, EWZ
Short - (none)
Deron Wagner is the Founder and Head Trader of both Morpheus Capital LP, a U.S. hedge fund, and Morpheus Trading Group, a trader education firm launched in 2001 that provides daily technical analysis of the leading ETFs and stocks. For a free trial to the full version of The Wagner Daily or to learn about Wagner's other services, visit MorpheusTrading.com or send an e-mail to deron@morpheustrading.com.
|