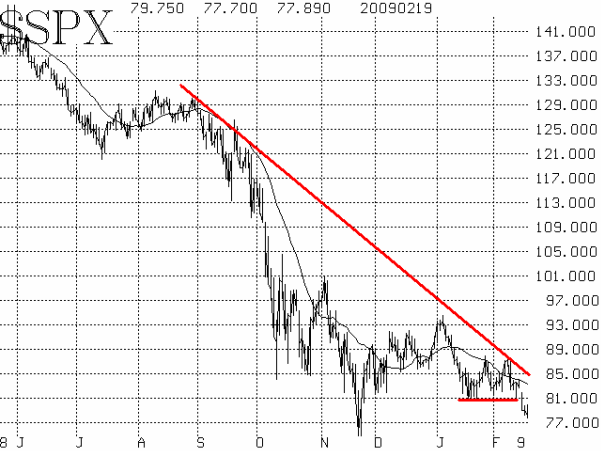
Sometimes the most important indicator is the only one you need to know about. The most important indicator, of course, is price. And this is one of those times. The technical indicators are mixed, but once $SPX broke down below the support area at 805-810 this week, the bearish pressure has been mounting. It certainly appears that the November lows will be tested -- and likely broken. The Dow Jones Industrials have already made new closing and intraday lows. At its current price of 779, $SPX is still well above its lows (closing low 752; intraday low 741).

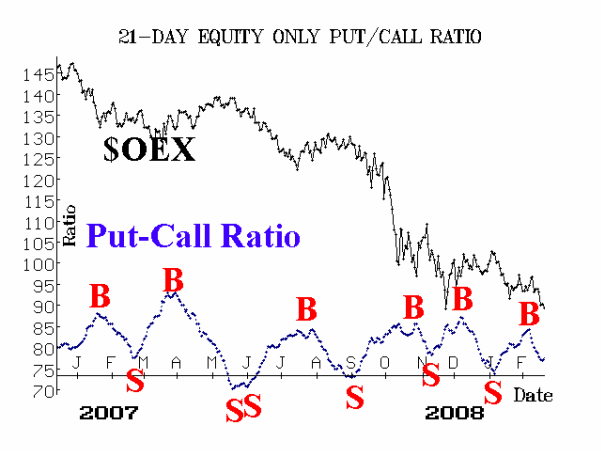
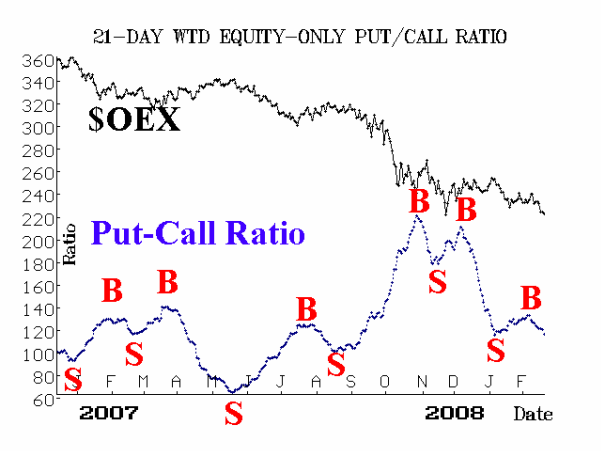
The equity-only put-call ratios have inexplicably remained bullish throughout this week. That is, they continue to decline. Since these ratios are trend-following indicators, it is extremely unusual to see such action. Put activity peaked almost two weeks ago and hasn't surged since, while call volume has remained relatively stable.

Market breadth has been poor this week, and breadth indicators are officially in deeply oversold territory. Thus, sharp but short-lived rallies are possible at any time. However, it should be noted that some of the worst declines in history have occurred while the market is oversold, so do not interpret an oversold reading as a buy signal.

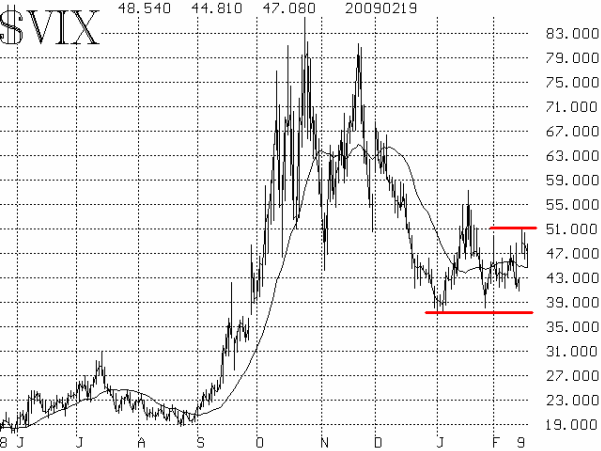
Volatility indices ($VIX and $VXO) have been surprisingly docile this week. True, they started from a high level, but except for a brief foray above 50 by $VIX on Tuesday, $VIX has not risen as the market has fallen. What specifically is causing this is that the implied volatility of $SPX options has not risen ($VIX is computed from the prices of $SPX options). This is true for all the expiration months, but especially for the near-term March expiration. $VIX itself remains trapped in a trading range between 38 and 50; it has not broken out as $SPX has.

In summary, the major trend is down. Oversold conditions might produce sharp, but short-lived rallies towards resistance at 805-810 and 830-840, but until there is some capitulation among complacent volatility measures, we don't foresee a bottom to this decline.
Lawrence G. McMillan is the author of two best selling books on options, including Options as a Strategic Investment, recognized as essential resources for any serious option trader's library.