| Near-Term Peak Approaching For SDS |
| By Mike Paulenoff |
Published
02/20/2009
|
Stocks
|
Unrated
|
|
|
|
Near-Term Peak Approaching For SDS
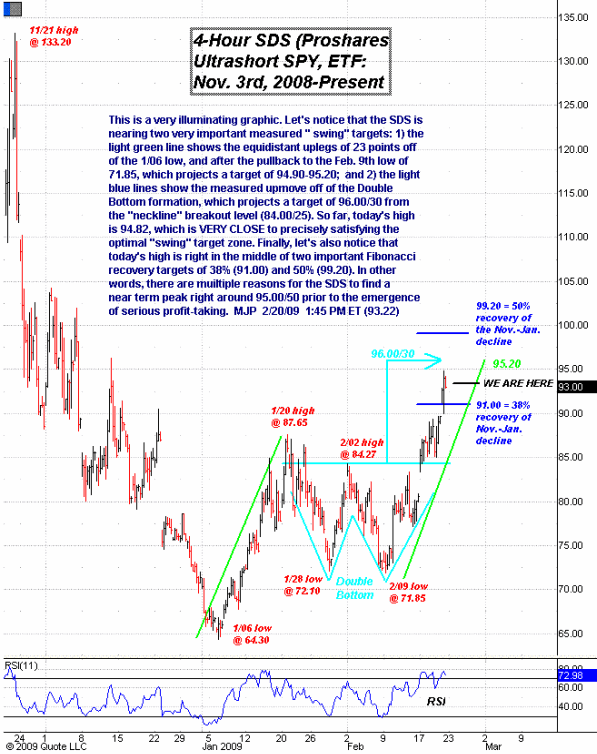
The 4-hour chart of the ProShares UltraShort SPY (SDS) is a very illuminating graphic. The SDS is near two very important "swing" targets: 1) the light green line shows the equidistant uplegs of 23 points off of the January 6 low, and after the pullback to the February 9 low of 71.85, which projects a target of 94.90-95.20; and 2) the light blue lines show the measured upmove off of the Double Bottom formation, which projects a target of 96.00/30 from the "neckline" breakout level (84.00/25). So far, today's high is 94.82, which is very close to precisely satisfying the optimal "swing" target zone. Finally, let's also notice that today's high is right in the middle of two important Fibonacci recovery targets of 38% (91.00) and 50% (99.20). In other words, there are multiple reasons for the SDS to find a near-term peak right around 95.00/50 prior to the emergence of serious profit-taking.

Mike Paulenoff is a 26-year veteran of the financial markets and author of MPTrader.com, a real-time diary of his technical chart analysis and trading alerts on all major markets. For more of Mike Paulenoff, sign up for a free 15-Day trial to his MPTrader Diary by clicking here.
|