| Corcoran Technical Trading Patterns For February 23 |
| By Clive Corcoran |
Published
02/23/2009
|
Stocks
|
Unrated
|
|
|
|
Corcoran Technical Trading Patterns For February 23
News regarding a further capital injection into Citigroup (C) that circulated late Sunday from an article in the Wall Street Journal appears to be providing some support in overseas markets.
The Hang Seng Index (HSI) in Hong Kong managed a three percent gain and most European markets are up between one and two percent in early trading on Monday morning. There has been no official acknowledgment of the exact nature of the Citigroup assistance and its effect on the capital structure but the number of $75 billion has surfaced.
In this writer's view the capital being made available to this behemoth bank is quite mind-boggling and shows an obstinate refusal to accept the obvious - this bank is insolvent and should be placed into some form of re-organization or nationalization or whatever other euphemism provides the necessary fig leaf.
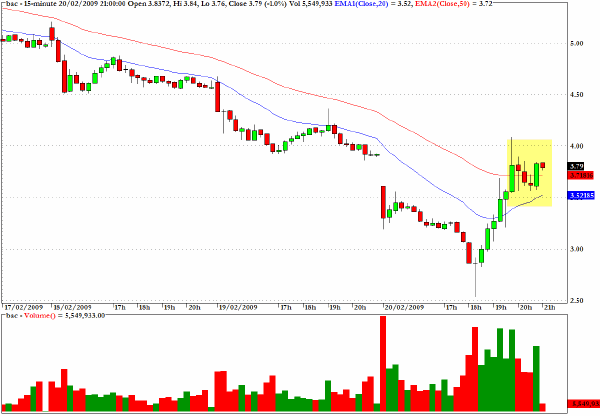
The short-term fate of the S&P 500 proxy, SPY, will hinge a lot on how the markets react to a more detailed specification of the assistance being provided to Citigroup and also how some of the other problematic banks, specifically Bank of America (BAC), see below, react to the developments.
In the longer term, Friday's action did not remove my concerns that the path of least resistance for US equities is still down.
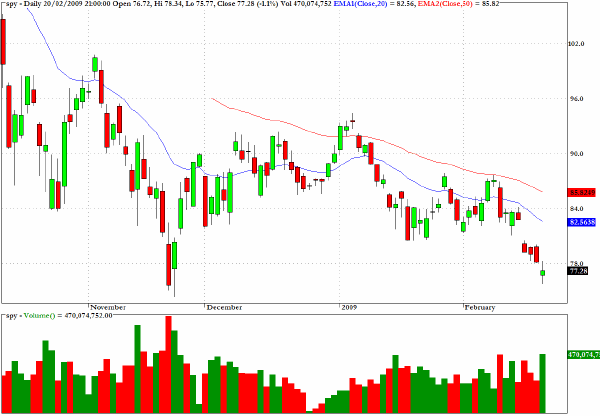
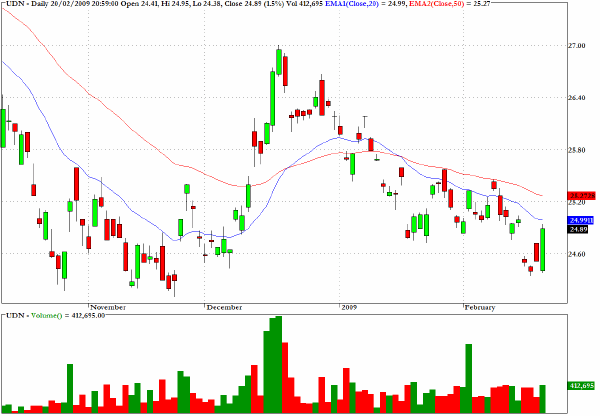
I am struck by the similar configuration and contours between the charts of SPY, above, and the exchange traded fund, UDN, which provides an inverse tracker to a broadly based dollar index. There is definitely a counter cylical trend emerging where, as risk aversion increases and equities sell off, so the dollar rallies and vice versa.
The Euro is benefiting from this trade in Europe this morning but as mentioned here recently there are some fairly profound structural problems confronting European monetary union and the euro, and it is a currency which would drop suddenly as capital flight by sovereign wealth funds surfaces again.
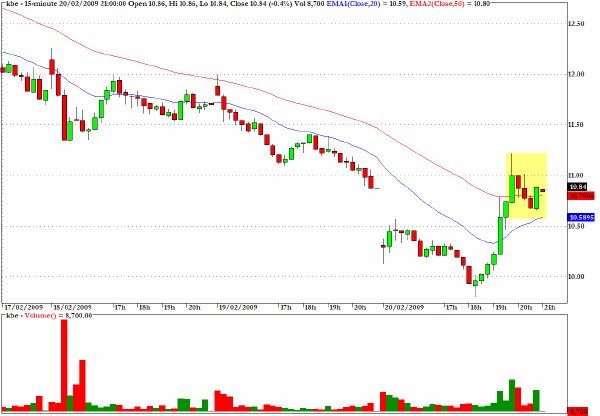
One of the key exchange traded funds to watch today will be KBE which is a proxy for the KBW Banking Index. The suggestion from Friday's afternoon trading, as is evident on the 15-minute chart below, is that a bullish flag pattern emerged before the end of Friday's session.
The weekend developments may provide an immediate impetus to the pattern but there is still capacity for negative surprises as the market digests the full implications of the world's best known bank slipping further into a coma in its intensive care unit.
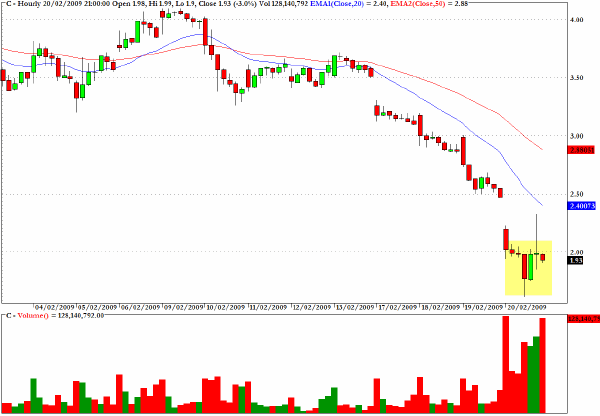
Citigroup (C) managed to see a minor bounce off its low on Friday afternoon but still closed below the $2.00 level.
It is hard to see how any kind of short-term government rescue plan is going to significantly differ from that well-known scenario of re-arranging the deckchairs on the Titanic.
The 15-minute chart for Bank of America (BAC) shows far more clearly a similar flag formation to that seen for KBE.
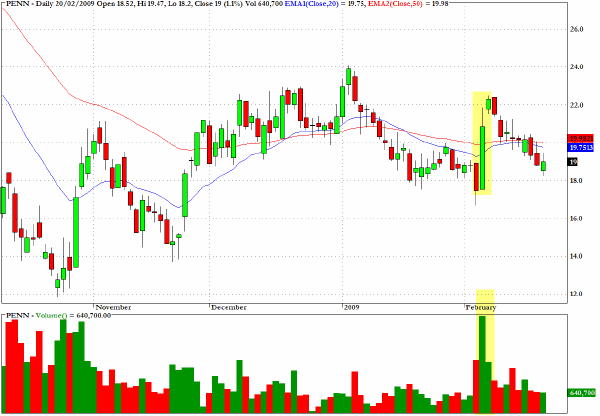
Penn National Gaming (PENN) has a rather well formed bullish flag formation on its daily chart.
Clive Corcoran is the publisher of TradeWithForm.com, which provides daily analysis and commentary on the US stock market. He specializes in market neutral investing and and is currently working on a book about the benefits of trading with long/short strategies, which is scheduled for publication later this year.
Disclaimer
The purpose of this article is to offer you the chance to review the trading methodology, risk reduction strategies and portfolio construction techniques described at tradewithform.com. There is no guarantee that the trading strategies advocated will be profitable. Moreover, there is a risk that following these strategies will lead to loss of capital. Past results are no guarantee of future results. Trading stocks and CFD's can yield large rewards, but also has large potential risks. Trading with leverage can be especially risky. You should be fully aware of the risks of trading in the capital markets. You are strongly advised not to trade with capital.
|