| The Wagner Daily ETF Report For February 23 |
| By Deron Wagner |
Published
02/23/2009
|
Stocks
|
Unrated
|
|
|
|
The Wagner Daily ETF Report For February 23
The broad market continued its losing streak on Friday, but divergence within the major indices was quite apparent. The Nasdaq Composite maintained its relative strength by slipping only 0.1%, but the benchmark S&P 500 lost 1.1%. Faring even better than the Nasdaq Composite was the large-cap Nasdaq 100 Index, which managed a gain of 0.4%. However, the Dow Jones Industrial Average closed 1.3% lower, the small-cap Russell 2000 fell 1.4%, and the S&P Midcap 400 declined 0.8%. Losses were substantially steeper in the morning, but an afternoon bounce more than halved earlier losses. The main stock market indexes closed just above the middle of their intraday ranges.
Turnover swelled across the board, though much of the faster pace was likely attributed to the monthly expiration of options last Friday. Total volume in the NYSE surged 42%, while volume in the Nasdaq rose 26%. As the stock market sold off all week, volume levels remained above average. Market internals improved slightly on Friday. In the Nasdaq, advancing volume fractionally exceeded declining volume. The NYSE adv/dec volume ratio was negative by just 3 to 1.
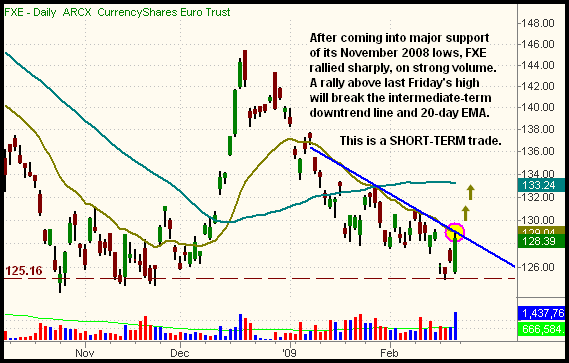
Last Friday, CurrencyShares Euro Trust (FXE) rallied sharply, closing right at resistance of its intermediate-term downtrend line and 20-day exponential moving average (EMA). Volume also spiked to more than double its average level, hinting at institutional buying interest. The daily chart of FXE is shown below:

With FXE sitting at major support of its November 2008 lows, a rally above the 20-day EMA and downtrend line shown above could provide a short-term momentum trading opportunity on the counter-trend bounce. We like FXE for long entry above the $129.10 area, with a short-term price target of the $133 area (resistance of the 50-day MA). With just a four-point profit target, a protective stop should be no more than two points. This makes for a positive reward-risk ratio of at least 2 to 1. Obviously, FXE could rally well beyond the $133 area, but this trade setup is merely intended to be a short-term countertrend bounce play. As such, we'll be more proactive about taking profits into strength.
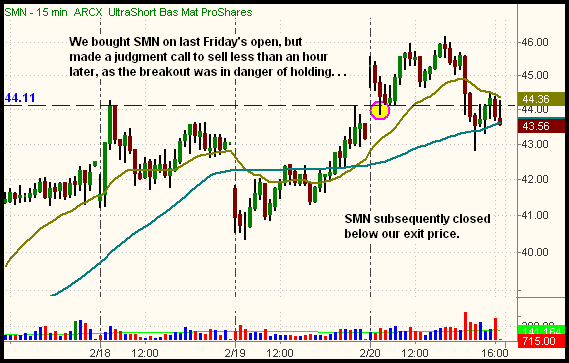
In last Friday's Wagner Daily, we pointed out the potential breakout setup in UltraShort Basic Materials ProShares (SMN), an inversely correlated "short" ETF. Specifically, we were looking to buy the breakout above a multi-month base of consolidation. Gapping up above resistance on Friday's open, we bought the breakout in SMN. However, we made a judgment call to sell it shortly thereafter, as it immediately moved lower to "fill the gap" as the major indices attempted to rally. This is shown on the 15-minute intraday chart interval of SMN below:

We've learned from experience that bad timing on a new short position can quickly lead to a large loss. As such, we opted to cut the trade for a very small loss instead. With breakout plays, it's often advisable to have the attitude of wanting to "be right or be right out." Furthermore, we can easily re-enter the trade if SMN confirms the breakout sometime this week.
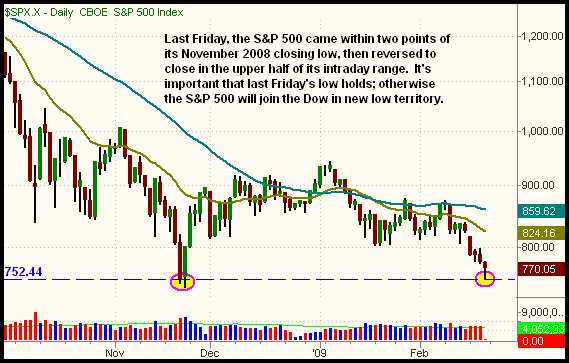
After the major indices broke support of their intermediate-term uptrend lines on February 17, the Dow Industrials promptly fell to a fresh six-year low. But because it's such a narrow-based index of 30 stocks, and the rest of the major indices were still above their November 2008 lows, we were not comfortable fully anticipating another leg lower in the stock market. As we enter this week, the big question is whether or not the S&P 500 will hold its November 2008 closing lows. Last Friday's low in the S&P 500 was just two points above the November closing low. This is marked by the horizontal line on the daily chart below:

We're now holding just one position in our model account (IBB long), as a mostly cash position makes sense until we see whether or not the S&P 500 is going to hold its prior low. Yet, we'll continue to scan for new opportunities in the coming week. Aside from the FXE setup explained above, we're also watching for a pullback or consolidation in gold/silver, which would provide us with re-entry points in those strongly trending ETFs.
Open ETF positions:
Long - IBB
Short - (none)
Deron Wagner is the Founder and Head Trader of both Morpheus Capital LP, a U.S. hedge fund, and Morpheus Trading Group, a trader education firm launched in 2001 that provides daily technical analysis of the leading ETFs and stocks. For a free trial to the full version of The Wagner Daily or to learn about Wagner's other services, visit MorpheusTrading.com or send an e-mail to deron@morpheustrading.com.
|