| Corcoran Technical Trading Patterns For February 24 |
| By Clive Corcoran |
Published
02/24/2009
|
Stocks
|
Unrated
|
|
|
|
Corcoran Technical Trading Patterns For February 24
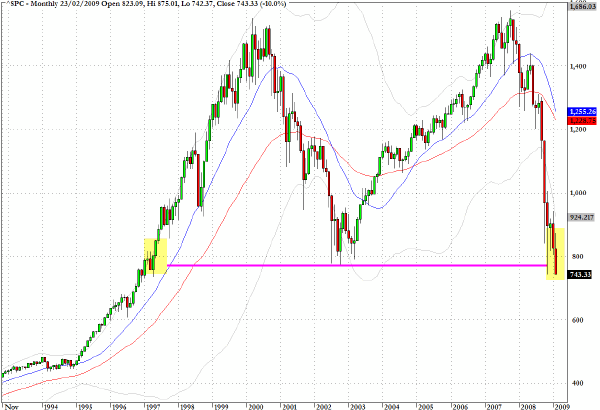
The S&P 500 (SPX) closed at its lowest level for almost 12 years.
The long-term monthly chart for this index covers a fifteen-year period and suggests that technicians must struggle to find any obvious clues as to where the next level of support kicks in.
I showed the chart to a friend who knows nothing about technical analysis and the comment was that it looked like an obvious "M" pattern. Simple when you think about it.
Furthermore, when you deal with monthly granularity patterns it becomes rather obtuse to try to identify any kind of complex wave count theory.
In hindsight, which is always 20/20, it seems abundantly clear now that the double top in late 2007 with the subsequent failure in the summer of 2008 to break back above the 20-month moving average (the blue line on the chart) was a major sell signal.
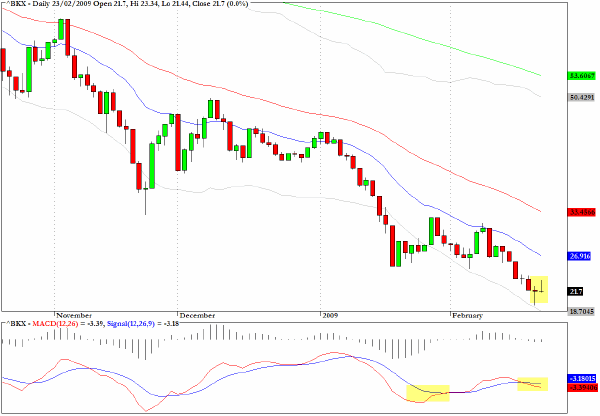
Even though it is hard to have anything positive to say about the KBW Banking Index (BKX), the case that I have made before shows that positive MACD divergences have survived the recent onslaught.
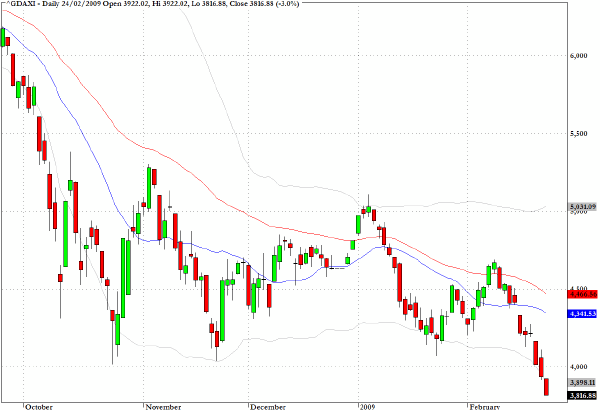
The DAX index in Germany has now clearly taken out its lows from last November as has the CAC40 Index in France, although the UK's FTSE still has some distance to go. It is worth pointing out that the German index still remains substantially above its 2003 lows while the FTSE could more easily revisit its 2003 lows and that is what I am expecting.
Meanwhile, the problems I have alluded to in Eastern Europe continue to worry the bankers of western Europe.
Commercial banks in Germany's immediate neighbor Austria have lent almost $300 billion to Eastern Europe, which is more than 70% of Austrian GDP. It has been estimated that even a 10% write-down could bankrupt the Austrian financial system. Meanwhile policymakers within the EU struggle with concerns emanating from the most troublesome eurozone economies - now becoming known as the PIGS: i.e. Portugal, Ireland, Greece and Spain.
I am becoming increasingly concerned that this could end in tears for the technocrats in Brussels.
The relationship between the Japanese yen and the US stock market is changing quite significantly. Whereas the yen has been seen as a safe haven play where investors have parked funds when US asset prices, especially stocks, are declining, the inverse now seems to be happening as the yen is falling in sync with declining US stock prices.
This has been observed in an article today from Bloomberg.
“The yen appears to be losing some of its safe-haven status,” said Masanobu Ishikawa, general manager of foreign exchange at Tokyo Forex & Ueda Harlow Ltd., Japan’s largest currency broker. “Japan’s economic and political situation is poor.”
The correlation between the dollar-yen and the Nikkei 225 was minus 0.89 since Feb. 16 when a report showed Japan’s economy shrank at an annual 12.7 percent pace in the last quarter, the most since the 1974 oil shock. The relationship was positive 0.86 in the 12 months to Feb. 16. A reading of 1 would mean the two moved in lockstep.
“The correlation has broken down, because the drivers are now changing,” Stannard said. “Dollar-yen in particular will continue to move quite sharply higher.”
Demand for the yen as a haven also declined after U.S. financial regulators said yesterday they will begin examinations this week to determine if banks have enough capital. Citigroup Inc. and Bank of America Corp. jumped on the announcement even as the S&P 500 closed at the lowest level in 12 years.
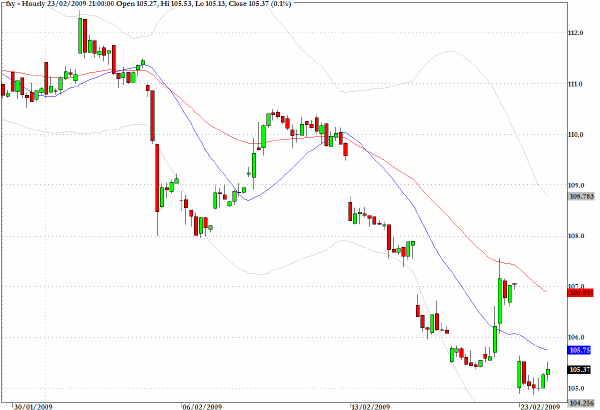
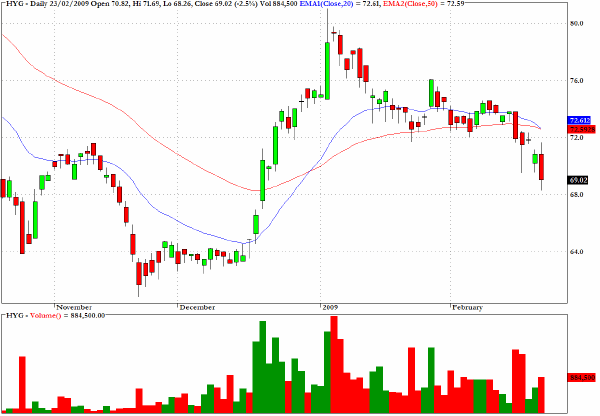
The chart for HYG, which tracks the high yield corporate bond market, is looking vulnerable to a possible re-test of the lows seen last November and December as there seems to be no obvious signs of support since the break below two key moving averages over the last few sessions.
Clive Corcoran is the publisher of TradeWithForm.com, which provides daily analysis and commentary on the US stock market. He specializes in market neutral investing and and is currently working on a book about the benefits of trading with long/short strategies, which is scheduled for publication later this year.
Disclaimer
The purpose of this article is to offer you the chance to review the trading methodology, risk reduction strategies and portfolio construction techniques described at tradewithform.com. There is no guarantee that the trading strategies advocated will be profitable. Moreover, there is a risk that following these strategies will lead to loss of capital. Past results are no guarantee of future results. Trading stocks and CFD's can yield large rewards, but also has large potential risks. Trading with leverage can be especially risky. You should be fully aware of the risks of trading in the capital markets. You are strongly advised not to trade with capital.
|