| Corcoran Technical Trading Patterns For February 26 |
| By Clive Corcoran |
Published
02/26/2009
|
Stocks
|
Unrated
|
|
|
|
Corcoran Technical Trading Patterns For February 26
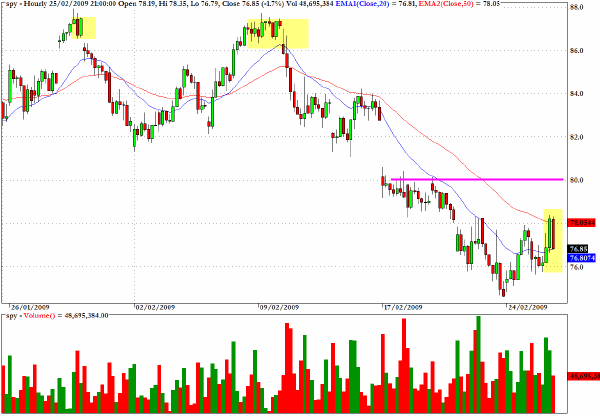
The S&P 500 proxy, SPY, sold off in the last hour of trading yesterday and leaves me sceptical about the follow-through prospects from Tuesday's rally.
Clearly the 80 level will be a major hurdle.
Here's a note from my personal blog.
I do hope that I am not alone in still being shocked by the Royal Bank of Scotland announcements this morning.
What is most shocking is that so much complacency and large number fatigue is setting in, that even when Alistair Darling admitted during a radio interview that just RBS alone needs to have insurance on almost half a trillion dollars worth of troubled assets, the interviewer took that number in his stride and then went on to another fairly innocuous question for the Chancellor.

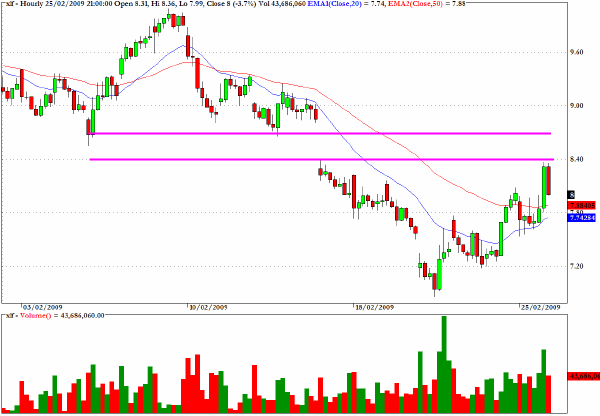
XLF has rallied back to an area of chart resistance. The space between the two lines drawn on the chart is effectively a no-man's land following the recent gap and could prove to be a real test for those who are making the case that the financials are ready to mount a meaningful rally.
As I have noted recently, there is one slightly counter-intuitive comfort in the technicals for the sector, which is the fact that the MACD momentum indicator is still pointing to a noticeable positive divergence.

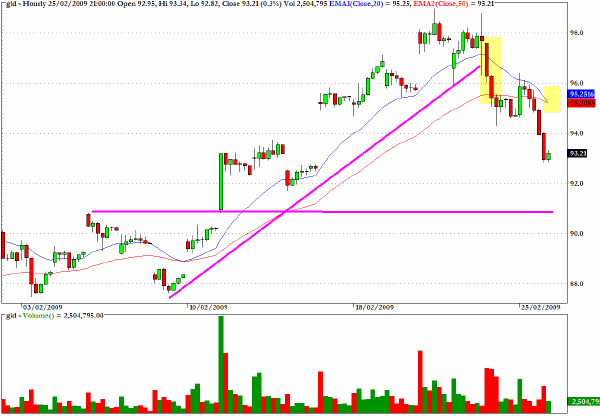
The hourly chart for gold indicates how the technical condition broke down rather drastically this week.
For the precious metal bulls, the $900 level for spot gold and the $90 level on the exchange traded fund, GLD, are now critical.

I shall simply repeat my comment from yesterday and indicate that I have changed the wording as reflected in the italics.
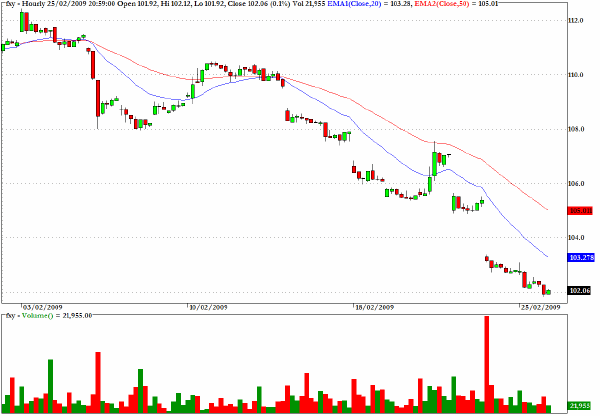
The decline in the Japanese yen is continuing, and, following the severe downward gap in FXY in yesterday's session, the target that I talked about last week of 102 has now been achieved.
As a note to Daily Form readers, discussion of individual securities will no longer be a daily feature of the free version of this newsletter but will appear on a less frequent basis. Further details regarding this change will be forthcoming in a separate mailing to current subscribers.

Clive Corcoran is the publisher of TradeWithForm.com, which provides daily analysis and commentary on the US stock market. He specializes in market neutral investing and and is currently working on a book about the benefits of trading with long/short strategies, which is scheduled for publication later this year.
Disclaimer
The purpose of this article is to offer you the chance to review the trading methodology, risk reduction strategies and portfolio construction techniques described at tradewithform.com. There is no guarantee that the trading strategies advocated will be profitable. Moreover, there is a risk that following these strategies will lead to loss of capital. Past results are no guarantee of future results. Trading stocks and CFD's can yield large rewards, but also has large potential risks. Trading with leverage can be especially risky. You should be fully aware of the risks of trading in the capital markets. You are strongly advised not to trade with capital.
|