|
The Wagner Daily ETF Report For February 26
Unable to mount any momentum from the previous day's rally, stocks bobbed and weaved throughout the day before finishing about 1% lower. Another afternoon rally initially looked encouraging, but the broad market swiftly turned tail in the final minutes of trading. The S&P 500, Nasdaq Composite, and Dow Jones Industrial Average registered identical losses of 1.1%. Small and mid-cap stocks fared worse. The Russell 2000 shed 2.7%, as the S&P Midcap 400 fell 1.4%. Showing indecision into the close, the main stock market indexes finished just below the middle of their intraday ranges.
Turnover was mixed. Total volume in the Nasdaq ticked 1% higher, but NYSE volume was 6% lighter than the previous day's level. Although trading was slightly slower in the NYSE, volume in both exchanges was still well above average levels. It's apparent institutions are still keeping an itchy trigger finger on the sell button, despite the previous day's accumulation. Nevertheless, market internals were not overly negative. In both the NYSE and Nasdaq, declining volume exceeded advancing volume by just 2 to 1.
We concluded yesterday's newsletter by saying, "Obviously, a strong one-day rally does not give us the "all clear" signal to start aggressive buying operations. In fact, there are very few ETFs with buyable chart patterns right now. Nevertheless, yesterday's rally off the S&P 500's November low was convincing enough to avoid the short side of the market (as well). . .we like the idea of a mostly cash position (excepting GLD, SLV, and FXE) until the market decides whether or not yesterday's (Tuesday's) rally was legitimate and sustainable." Given yesterday's "chopfest" that followed, we were indeed glad to be fully in cash because bulls and bears equally got whipped around.
Because the intraday highs of the major indices were higher than the previous day's highs, and the intraday lows were higher than the previous day's lows, one could argue that yesterday's session slightly favored the bulls. Still, it wasn't very convincing either way. Overall, yesterday's market action did little to change the technical picture of the major indices, as the S&P 500 is still trying to decide whether or not it wants to hold the November 2008 low. Volume patterns over the past several days have given a mixed picture as well.
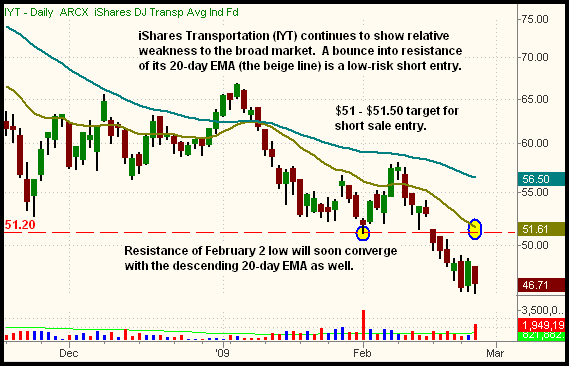
Frankly, we're perfectly content for our model ETF account to be fully in cash right now because there just aren't many patterns with positive risk/reward ratios at present. On the short side, many ETFs have fallen so far, so fast, that the risk of getting run out of the position in the near-term outweighs the potential for further downside gains in the coming days. However, there are a few ETFs we're now monitoring for a shortable bounce into resistance. One such ETF is iShares Transportation (IYT):

As you may recall, we initially pointed out the relative weakness in the transportation sector at the beginning of this month, when the Dow Jones Transportation Average ($DJT) fell to test its November 2008 lows ahead of the Dow Jones Industrial Average ($DJI). That relative weakness has persisted since then, causing IYT to tumble to its all-time lows. If the stock market bounces in the coming days, taking IYT along with it, we may get an ideal short entry on a rally into resistance of the 20-day exponential moving average, which roughly converges with resistance of the February 2 "swing low." Rather than selling short the initial breakdown, we prefer to wait for an ETF to fall below a key area of support, then sell short the first subsequent bounce into new resistance of that prior support level. Entering in such a fashion eliminates the possibility of getting suckered into selling short a false breakdown that swiftly reverses. With IYT, a rally into the $51 to $51.50 area provides us with a low-risk short entry on the bounce into resistance.
As for possible long setups, most ETFs are stuck below key resistance levels, such as their 20 and 50-day moving averages. As such, we're not seeing the types of bullish consolidation patterns we like to buy when the ETFs subsequently break out. The most bullish patterns are still in gold (GLD) and silver (SLV), both of which corrected further in yesterday's session.
Now that GLD and SLV are approaching support of their 20-day exponential moving averages, we'll be closely monitoring for a potential re-entry on the long side. When buying a pullback of a steadily uptrending ETF, we like to wait for confirmation that the short-term correction has run its course before jumping back in. After the pullback, we specifically look to buy the first breakout above the hourly downtrend line that formed during the retracement off the recent high. The 20-period exponential moving average on the hourly chart often converges with that ultra short-term downtrend line that forms. With this type of play, realize our goal is not to catch the bottom of the pullback; rather, we aim to catch the meat of the next move that occurs after the ETF confirms it's ready to move back up.
Open ETF positions:
Long - (none)
Short - (none)
Deron Wagner is the Founder and Head Trader of both Morpheus Capital LP, a U.S. hedge fund, and Morpheus Trading Group, a trader education firm launched in 2001 that provides daily technical analysis of the leading ETFs and stocks. For a free trial to the full version of The Wagner Daily or to learn about Wagner's other services, visit MorpheusTrading.com or send an e-mail to deron@morpheustrading.com.
|