| Bullish Pattern For Semiconductors (SMH) |
| By Mike Paulenoff |
Published
02/26/2009
|
Stocks
|
Unrated
|
|
|
|
Bullish Pattern For Semiconductors (SMH)
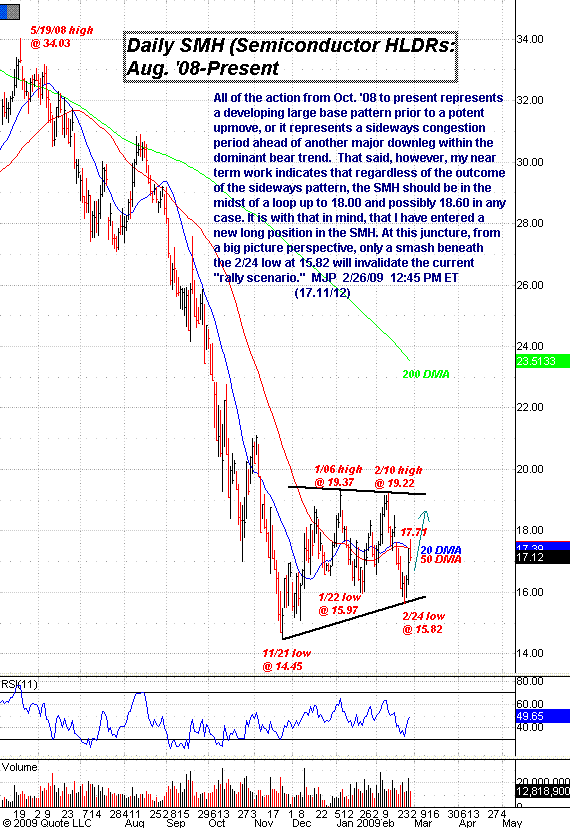
All of the action from October 2008 to the present represents a developing large base pattern prior to a potent upmove, or it represents a sideways congestion period ahead of another major downleg within the dominant bear trend. That said, however, my near-term work indicates that regardless of the outcome of the sideways pattern, the Semiconductor HLDRs ETF (SMH) should be in the midst of a loop up to 18.00 and possibly 18.60 in any case. At this juncture, from a big picture perspective, only a smash beneath the 2/24 low at 15.82 will invalidate the current rally scenario.

Mike Paulenoff is a 26-year veteran of the financial markets and author of MPTrader.com, a real-time diary of his technical chart analysis and trading alerts on all major markets. For more of Mike Paulenoff, sign up for a free 15-Day trial to his MPTrader Diary by clicking here.
|