| The Wagner Daily ETF Report For February 27 |
| By Deron Wagner |
Published
02/27/2009
|
Stocks
|
Unrated
|
|
|
|
The Wagner Daily ETF Report For February 27
Stocks got off to a higher start yesterday morning, but reversed lower after testing resistance of their previous day's highs. The major indices subsequently trended south throughout the afternoon before settling near their recent lows. The Dow Jones Industrial Average fell 1.2% and the S&P 500 lost 1.6%. The Nasdaq Composite, which had formerly been showing relative strength within the broad market, showed bearish divergence yesterday. The tech-heavy Nasdaq declined 2.4%. The small-cap Russell 2000 and S&P Midcap 400 indices shed 2.1% and 1.8% respectively. All the main stock market indexes closed near their worst levels of the day.
Lower turnover across the board helped temper the pang of yesterday's losses. Total volume in the NYSE was 14% lower than the previous day's level, while volume in the Nasdaq declined 2%. Still, trading remained above 50-day average levels, which is negative on a day of losses. On February 24, the Nasdaq Composite scored an "accumulation day" by rallying on higher volume, but the index marked a bearish "distribution day" in the following session. Until we see a string of higher volume gains in the broad market, which sets the pace for a sustainable rally, we must be prepared for continued chop and indecision.
In yesterday's Wagner Daily, we discussed the potential buy setups that were forming in SPDR Gold Trust (GLD) and iShares Silver Trust (SLV). To refresh your mind of the deails, we said, "Now that GLD and SLV are approaching support of their 20-day exponential moving averages, we'll be closely monitoring for a potential re-entry on the long side. When buying a pullback of a steadily uptrending ETF, we like to wait for confirmation that the short-term correction has run its course before jumping back in. After the pullback, we specifically look to buy the first breakout above the hourly downtrend line that formed during the retracement off the recent high. The 20-period exponential moving average on the hourly chart often converges with that ultra short-term downtrend line that forms. With this type of play, realize our goal is not to catch the bottom of the pullback; rather, we aim to catch the meat of the next move that occurs after the ETF confirms it's ready to move back up."
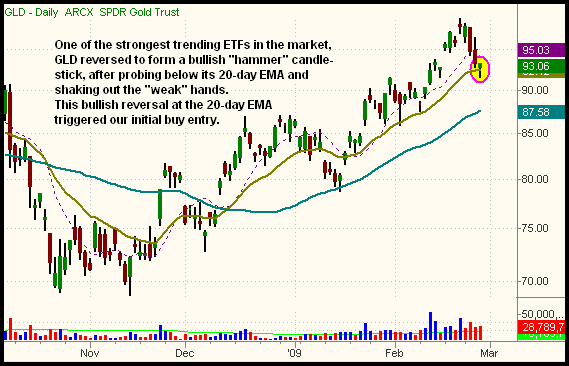
Yesterday, GLD dipped briefly below its 20-day EMA, shaking out the "weak hands," but reversed to close at its intraday high. Upon noticing this action, we bought back into Gold Double Long (DGP), which follows a very similar pattern to GLD, but is leveraged to move at twice the percentage gain or loss. Closing the day with a bullish "hammer" candlestick, both GLD and DGP are now positioned to resume their primary uptrends. The daily chart of GLD below illustrates this:

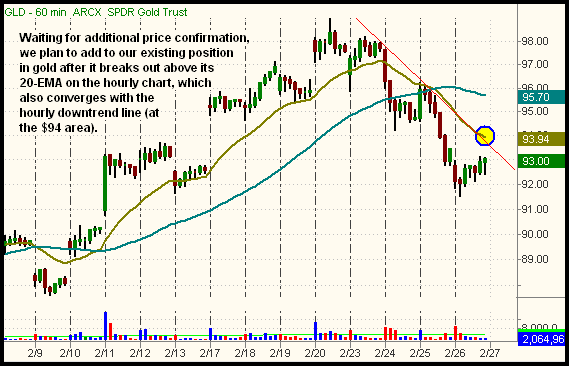
Even though GLD has not yet rallied above its hourly downtrend line or 20-period EMA on the hourly chart, the February 26 probe below the 20-day EMA and subsequent intraday reversal was bullish enough to prompt us to enter with a partial position. So far, we bought only half the shares we intend to accumulate, but may add the remaining shares when GLD confirms its reversal by rallying above the hourly downtrend line (above the $94 area). Although not illustrated, SLV has a similar pattern and can be managed in the same way. The trigger for potentially buying additional shares of GLD is shown on the hourly chart below:

Because some retirement accounts are forbidden from buying exchange traded notes (ETNs) such as DGP, we used GLD in our examples above, rather than DGP. Since both symbols roughly follow the same pattern, traders who are unable to purchase DGP may wish to buy GLD instead. The GLD position can subsequently be managed based on our actions in DGP.
As we enter the last trading day of the month, the main stock market indexes are poised to open near the lows of their five-day consolidation patterns. On February 24, prior support of the S&P 500's low from November 2008 gave stocks a good excuse to rally on higher volume. But now, just two days later, the index has given back a majority of that day's gain. Worse is the Nasdaq Composite, which has erased nearly all of that day's gain. Based on the inability of stocks to retain that day's gains, it looks as though the broad market may be headed for another leg down, pulling all the major indices firmly below their November 2008 lows. However, let us remind you we're in a very news-driven market; right now, the market simply feels as if it's waiting for some kind of news to lend an excuse for at least a short-term rally. The bottom line is that the market's mixed signals means caution is in order on both sides of the market. Since our only open ETF position is Gold Double Long (DGP), it feels good to be able to avoid the broad-based choppiness affecting stocks in a plethora of sectors. Cash is king...or is gold?
Open ETF positions:
Long - DGP
Short - (none)
Deron Wagner is the Founder and Head Trader of both Morpheus Capital LP, a U.S. hedge fund, and Morpheus Trading Group, a trader education firm launched in 2001 that provides daily technical analysis of the leading ETFs and stocks. For a free trial to the full version of The Wagner Daily or to learn about Wagner's other services, visit MorpheusTrading.com or send an e-mail to deron@morpheustrading.com.
|