| The Wagner Daily ETF Report For March 2 |
| By Deron Wagner |
Published
03/2/2009
|
Stocks
|
Unrated
|
|
|
|
The Wagner Daily ETF Report For March 2
After opening substantially lower last Friday morning, stocks feebly attempted to recover throughout the morning, but the bears resumed control in the afternoon, causing the major indices to finish near their morning lows. The Nasdaq Composite fell 1.0%, the Dow Jones Industrial Average 1.7%, and the S&P 500 2.4%. The small-cap Russell 2000 and S&P Midcap 400 indices declined 1.0% and 0.8% respectively. Closing lower for the seventh week of the past eight, the S&P 500 also joined the Dow by violating support of its November 2008 low. Both the S&P 500 and Dow Jones Industrial Average now stand at their lowest levels since 1997.
Driven by a 1.8 billion share volume spike in Citigroup (C), total volume in the NYSE swelled 51% above the previous day's level. Trading in the Nasdaq rose just 7%, but still indicated the presence of institutional selling. Declining volume in the NYSE exceeded advancing volume by a margin of approximately 4 to 1. The Nasdaq adv/dec volume ratio was negative by less than 2 to 1.
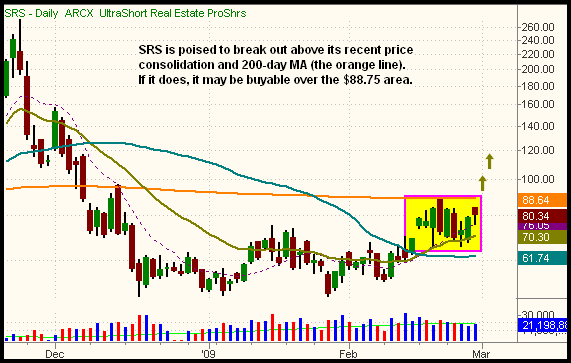
The Nasdaq Composite still remains above support of its November 2008 low, but just broke support of its January 2009 lows. With the S&P and Dow now at fresh 11-year lows, it may be only a matter of days until the Nasdaq falls to join those indexes as well. The lack of significant areas of prior price support to slow the decline is obviously bad news for long-term "buy and hold" investors. However, it may actually be beneficial to short-term "trend traders" because another leg down in the stock market should be more tradeable than the sideways, indecisive action the market has exhibited for the past several months. Accordingly, several of the inversely correlated "short ETFs" are now poised to break out above bands of price consolidation, creating potential trade opportunities. One such ETF is UltraShort Real Estate ProShares (SRS):

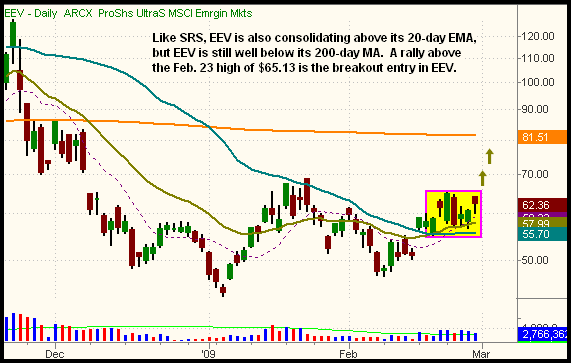
With the 20-day exponential moving average (the beige line) providing support below, SRS is now positioned to break out above resistance of its 200-day moving average (the orange line), which converges with the highs of its recent consolidation. If it does, SRS can be bought above the $88.75 area. Another ETF we're monitoring for a potential swing trade is UltraShort Emerging Markets ProShares (EEV); its daily chart is annotated below:

The chart of EEV is similar to SRS, in that the 20-day EMA is acting as support while EEV consolidates in a tight range. But one difference is that the 200-day MA is still well above the current price of EEV. With this setup, we're looking for a potential buy entry above the February 23 high of $65.13.
Like many of the UltraShort ETFs, both SRS and EEV are quite volatile. If trading either ticker, be sure to adjust your share size accordingly, in order to account for the rather wide stop that is necessary. Also, as recently discussed in this newsletter, remember the UltraShort sector ETFs are generally better for short-term "momentum" trading than long-term holding. When holding over the long-term, they significantly underperform the corresponding indexes due to daily portfolio adjustment of their derivative contracts.
In last Friday's Wagner Daily, we said we were planning to add to our position in Gold Double Long (DGP) when it moved above resistance of its hourly downtrend line and 20-day EMA. However, because that move occurred in the form of an opening gap, we waited to see whether or not the gap would hold before making a decision to buy additional shares. Fortunately, we held off, as both silver and gold subsequently reversed later in the morning. Now, the anchor points of the hourly downtrend line have been adjusted to connect with last Friday's opening highs. This means the new level to consider adding additional shares is above the $21.30 area (around $93.50 for GLD). Again, we'll take it slowly before jumping in with additional shares, as we want to ensure gold provides adequate confirmation of stabilization on the pullback.
Open ETF positions:
Long - DGP
Short - (none)
Deron Wagner is the Founder and Head Trader of both Morpheus Capital LP, a U.S. hedge fund, and Morpheus Trading Group, a trader education firm launched in 2001 that provides daily technical analysis of the leading ETFs and stocks. For a free trial to the full version of The Wagner Daily or to learn about Wagner's other services, visit MorpheusTrading.com or send an e-mail to deron@morpheustrading.com.
|