| Corcoran Technical Trading Patterns For March 3 |
| By Clive Corcoran |
Published
03/3/2009
|
Stocks
|
Unrated
|
|
|
|
Corcoran Technical Trading Patterns For March 3
Selling is now begetting more selling and key levels were violated yesterday in many global markets.
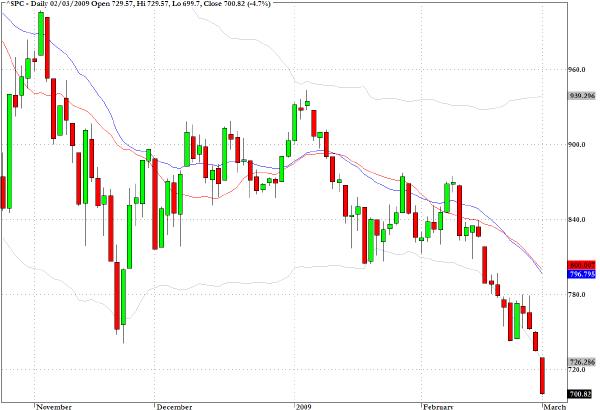
The S&P 500 Cash Index (SPX) actually violated the 700 level intraday with a low print for the session of 699.7. Even if some kind of rebound rally can be mounted I suspect that 740 will now become an area of strong resistance to upside progress.
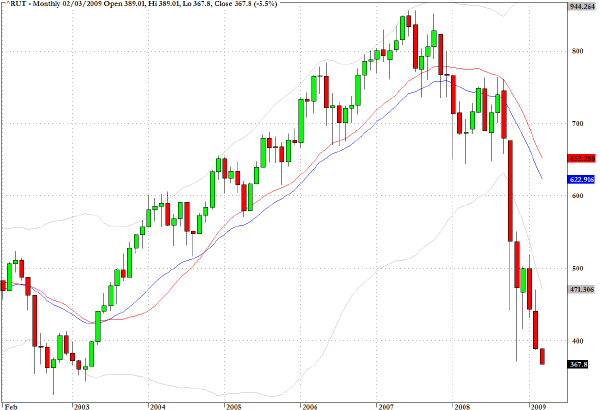
The Russell 2000 (RUT) dropped by 5.5% and seems to be headed towards the 330/50 area that I discussed in yesterday's commentary.
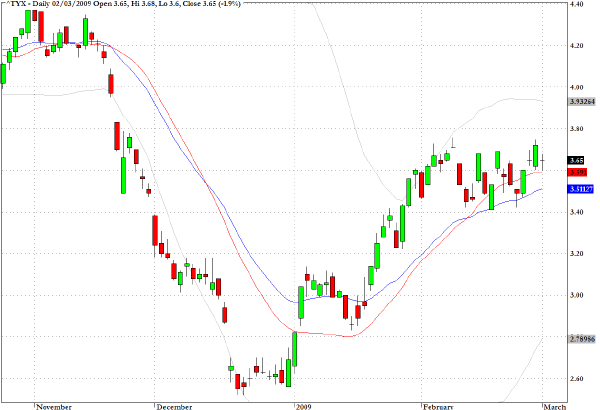
Despite yesterday's sell-off, the long end of the US Treasury spectrum of maturities barely budged.
It has been estimated that the US alone has to issue about $2 trillion of Treasury securities this year and this should keep PIMCO et al somewhat less enamoured with the attractiveness of 30-year bonds with coupons with a 3 handle.
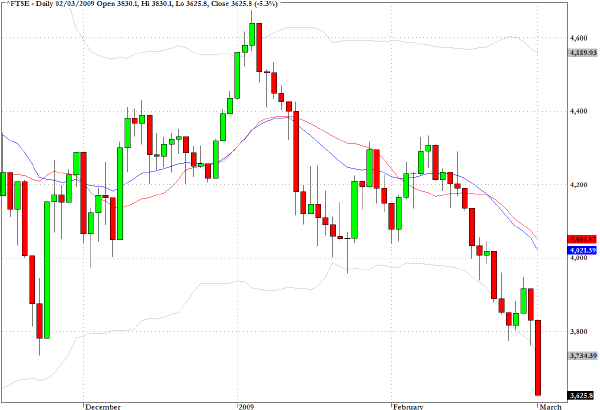
The FTSE broke below its late October low, and now the March 2003 lows appear to be back in play.
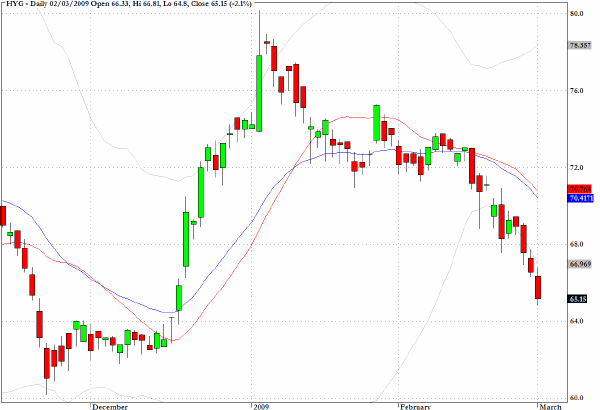
Here are my comments from a week ago on HYG.
The chart for HYG, which tracks the high yield corporate bond market, is looking vulnerable to a possible retest of the lows seen last November and December as there seem to be no obvious signs of support since the break below two key moving averages over the last few sessions.
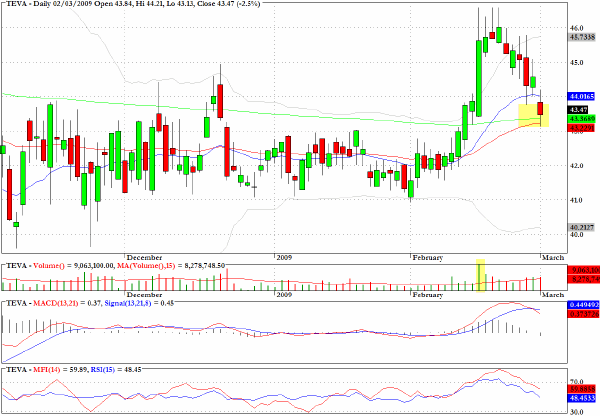
It's hard to have any firm views on individual charts at the moment, but TEVA could be worth consideration on the long side if the market finds some stability.
Clive Corcoran is the publisher of TradeWithForm.com, which provides daily analysis and commentary on the US stock market. He specializes in market neutral investing and and is currently working on a book about the benefits of trading with long/short strategies, which is scheduled for publication later this year.
Disclaimer
The purpose of this article is to offer you the chance to review the trading methodology, risk reduction strategies and portfolio construction techniques described at tradewithform.com. There is no guarantee that the trading strategies advocated will be profitable. Moreover, there is a risk that following these strategies will lead to loss of capital. Past results are no guarantee of future results. Trading stocks and CFD's can yield large rewards, but also has large potential risks. Trading with leverage can be especially risky. You should be fully aware of the risks of trading in the capital markets. You are strongly advised not to trade with capital.
|