When stocks enter into a countertrend bounce off the lows, they usually probe above the actual resistance level, squeezing out the short sellers in the process, before heading back down. Deron Wagner urges traders to use caution over the next several days if they're still short.
After starting the day slightly higher, stocks chopped around near their previous day's lows before closing modestly lower. The Nasdaq Composite slipped just 0.1%, as both the S&P 500 and Dow Jones Industrial Average lost 0.6%. Showing relative weakness, the small-cap Russell 2000 closed 1.9% lower, but the tech-heavy Nasdaq 100 Index conversely gained 0.4%. The S&P Midcap 400 declined 0.7%. Most of the main stock market indexes finished near the bottom quarter of their intraday ranges.
Turnover was mixed. Total volume in the NYSE declined 4% below the previous day's level, while volume in the Nasdaq ticked 4% higher. Trading in both exchanges has remained at higher than average levels for the past several weeks. Specifically, institutions have been actively participating on the sell side ever since the Dow broke down to a fresh 11-year low, back on February 19.
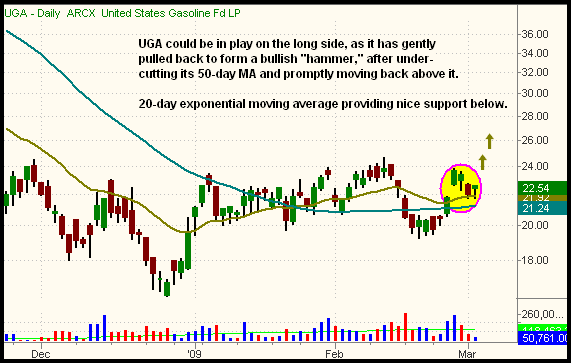
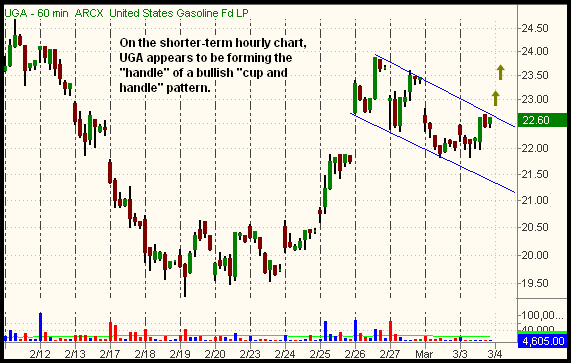
One ETF that may be in play today is U.S. Gasoline Fund (UGA). While other energy commodity ETFs, such as crude oil, have been hanging out near their lows, UGA has been consolidating above its 50-day moving average. Recently, it undercut support of its 50-day moving average, but jumped back above it last week. Since then, UGA has been forming a "bull flag" pattern, right above support of its 20-day exponential moving average. On the shorter-term hourly chart, UGA appears to be forming the "cup" of a bullish "cup and handle" pattern. Check out the daily and hourly charts below: 

If the "bull flag" pattern follows through to the upside, UGA could be bought above the two-day high of $22.80, with a stop below support of the 50-day moving average, presently at $21.24. Another nice thing to consider about UGA is that it has practically no correlation to the direction of the actual stock market.
In yesterday's commentary, we spoke of some of the traits that typically mark "capitulation," the point at which a downtrending market eventually puts in a bottom. Based on recent price action and the lack of a massive volume spike at the lows, we've not yet seen any signs that indicate a significant bottom is forming (bear in mind "capitulation" is more of a process than a one-time event). Nevertheless, our scans conducted at mid-day yesterday turned up approximately 70 bullish "hammer" formations on the hourly charts. These included individual stock tickers such as GS, POT, CP, THOR, ISRG, ADM, and UBB, just to name a few. Alongside of a late-day sell-off in the broad market, most of these patterns subsequently failed in the afternoon. Still, it was certainly the greatest number of short-term reversal bars we have seen in quite a while.
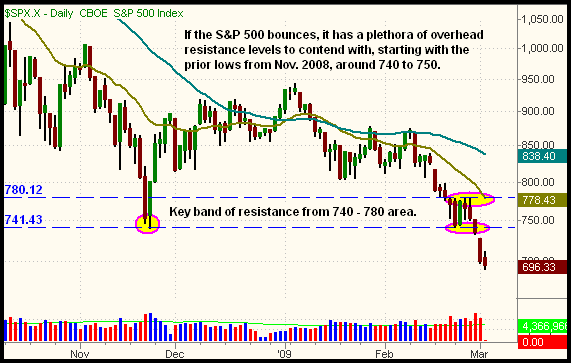
If the lows of the past two sessions hold up, those "hammers" we discussed could lead the broad market to a small bounce in the coming days. However, if attempting to play the quick momentum from such a bounce, consider taking profits quickly because there is a ton of overhead supply the stock market must contend with. This is shown on the daily chart of the S&P 500 below: 
One of the most basic tenets of technical analysis is that a prior level of support becomes the new level of resistance, after that support is broken. As such, the prior lows from November 2008, which the S&P 500 sliced through a couple of days ago, will become the first significant level of resistance the index will need to deal with on any rally attempt. If the index manages to surge right through that resistance level, the 20-day exponential moving average and "swing high" from last week will provide substantial resistance at the 775 - 780 area.
When stocks enter into a countertrend bounce off the lows, they rarely stop right at the actual resistance levels. Instead, they usually probe above the actual resistance level, squeezing out the short sellers in the process, before heading back down. Use caution over the next several days if you're still short. Further, short positions should be managed with very tight stops right now, along with the intention to possibly re-enter them after we see how far any bounce could take the market from "oversold" levels.
Open ETF positions:
Long - DGP, QQQQ
Short - (none)
Deron Wagner is the Founder and Head Trader of both Morpheus Capital LP, a U.S. hedge fund, and Morpheus Trading Group, a trader education firm launched in 2001 that provides daily technical analysis of the leading ETFs and stocks. For a free trial to the full version of The Wagner Daily or to learn about Wagner's other services, visit MorpheusTrading.com or send an e-mail to deron@morpheustrading.com.