NASDAQ COMMENTARY
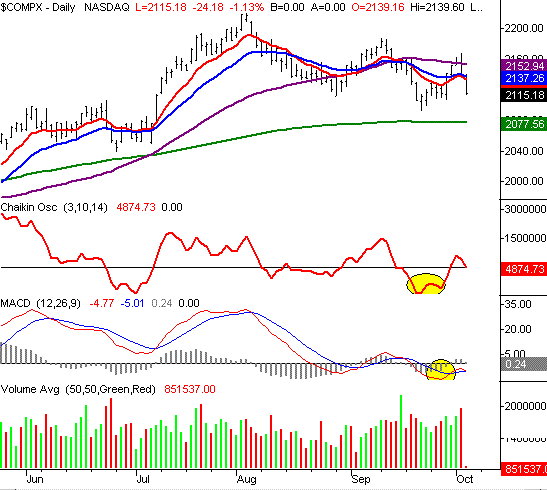
The NASDAQ Composite took yet another hit this morning, falling all the way to 2113.94 before the bleeding finally stopped. Add in Tuesday's decimation, and you're left with a very painful week for the bulls who were enjoying last week's gains. As of right now, the NASDAQ is down 28 points (-1.3%) for the week. But the real worry at this point is the technical damage that was inflicted with this morning's selloff. There's a lot of ground that needs to be made up before the end of the trading day. Otherwise, the bulls may throw in the towel and let the bears continue on the rampage.
The biggest problem created with today's dip is the cross back under the 10 and 20 day moving averages (red and blue). It was just last week that we moved above those lines, and we thought that was going to inspire even more buying. All those buyers had a change of heart over the weekend. After hitting this week's high of 2162.79 on Monday, the composite pulled back to close at 2155.43, giving up almost the entire intra-day gain. Things haven't gotten any better since then.
As for technical indicators, two of the key ones that looked so bullish last week have really started to turn bearish. Those are the Chaikin line, and the MACD lines. Both are still technically bullish in that each is still in that 'bullish crossover' territory. But in both cases, it looks like it's only a matter of time before they turn bearish again. In fact, yesterday's volume for the NASDAQ ended up being relatively high. This wasn't mirrored for all the indexes, but it does qualify as a distribution day for the composite. So barring any big turnarounds, that sell signal could be clinched soon.
So how did things change so quickly? This back-and forth game of ping-pong has actually been the mode all year long - especially over the last two months. But as for the 'why', we still see fear and greed as the key drivers right now. Since those two factors are finicky and short-lived, so are most trends. It doesn't help any that earnings season is upon us, and that oil prices are still a touchy subject in the post-hurricanes environment.
As for where we're headed next, this selloff is a little suspicious. Nothing has really changed this week that we didn't actually know about last week...even earnings, really. Given that we've danced around the 10 and 20 day averages for most of the year, it's difficult to think this crossunder means much more than the last ones did. For the record, this is the fifth time since late August that we've crossed the 10 day line, and the NASDAQ is now right where it was in early July. That's the subtle way of saying this market really hasn't done much of anything to get excited about, good or bad.
NASDAQ CHART - DAILY

S&P 500 COMMENTARY
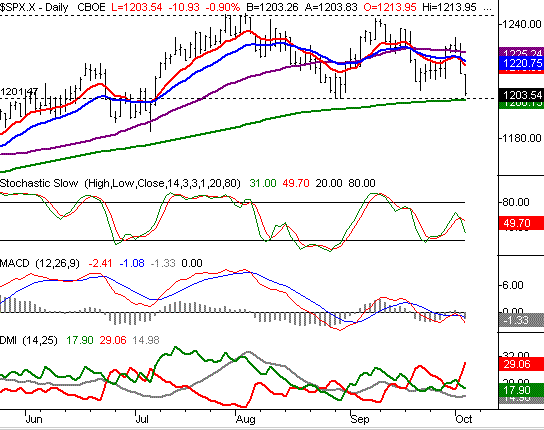
While the NASDAQ is still technically bullish in a few ways, the same can't be said for the S&P 500. It also fell under its 10, 20, and 50 day lines this week, just a few days after crossing above them all in what looked to be a good start to a bullish move. But as we all know by now, stocks are taking a beating, and we have to repeal our prior bullish outlook. In fact, technical reads turned largely bearish after yesterday.......and today's not helping.
Our stochastic lines are bearish, in that the %K line (green) has fallen under the %D line (red). We also see a new MACD crossunder. Directional Movement Index lines are also showing a new sell signal. The point is, that's a lot of bear signs, and you'd be crazy to ignore them. That's why we're not.
There is one potential reversal catalyst on the horizon. The next possible landing will be the 200 day line, at 1200. That level is re-enforced by the fact it's a big round number (which the market collectively loves to use as support and resistance). Today's low (as of the time of this writing) is 1202.94, and falling. So, we may see this happen - or not happen - within a few hours. From that point, there are going to one of two outcomes. The first outcome could be strong support and a huge bounce higher. The last two days have handed us some major selling, and in many regards, stocks are well oversold and ripe for a rebound. The second possibility is a close under 1200. If this occurs, it will be the first time the SPX has been under the 200 day average since May. Plus, there's not many (if any) strong support levels under 1200, so a slight slip-up here could lead to rather bearish results.
Despite the fact that all the indicators have turned bearish, and that stocks are falling sharply here, we contend that you may want to see what happens next for the S&P 500. We're right on the verge of a big move, and you definitely don't want to be on the wrong side of it.
S&P 500 CHART - DAILY

DOW JONES INDUSTRIAL AVERAGE COMMENTARY
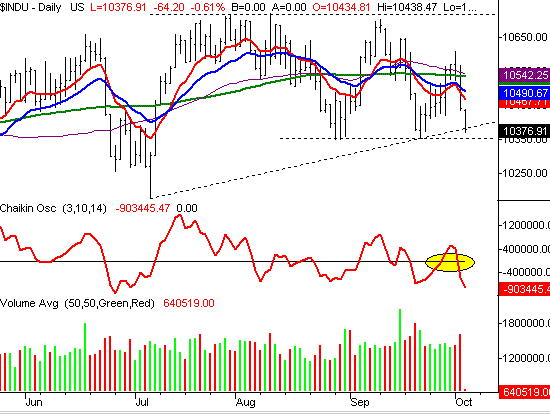
There's not a lot to add here. The Dow's tumble under all the key moving averages is bearish, and we can already see a bearish Chaikin line crossunder here. So, the sellers have a strong case.
The last line of defense the bulls are holding onto here is the support at 10,386, which traces the lows from April 20th, July 7th, and September 22nd. That support is really being tested today though, as the low is resting right on that line. Beyond that, we've seen mild support around 10,350. So like the S&P, it may be worth the wait just to see if the bears can get past these last hurdles before assuming we're due for a freefall.
On the other hand, we have noticed something worth a closer look. The Dow Jones Industrial Average hit peaks on August 10th, September 12th, and now, October 3rd. That's a series of significant lower highs, and a lower low from here isn't out of the question. If the pattern comes to completion, which is very possibly, that would be a sign of bigger picture weakness for the index. The support at 10,350 will be the make-or-break mark in that regard.
Just for perspective, the Dow is right where it was in early July. That's a testament to how choppy and sideways things have been.
DOW JONES INDUSTRIAL AVERAGE CHART - DAILY

Price Headley is the founder and chief analyst of BigTrends.com.