| Corcoran Technical Trading Patterns For March 5 |
| By Clive Corcoran |
Published
03/5/2009
|
Stocks
|
Unrated
|
|
|
|
Corcoran Technical Trading Patterns For March 5
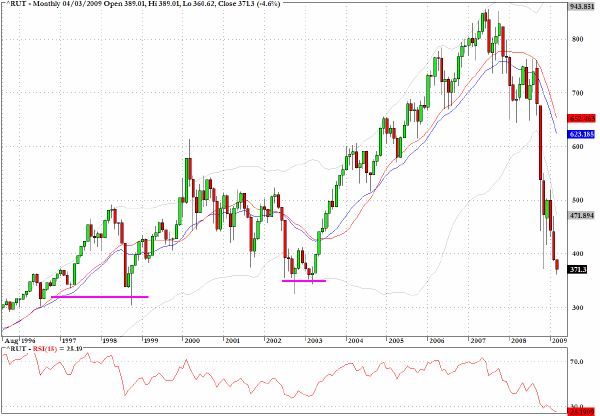
The Russell 2000 Index (RUT) participated in yesterday's rally but, in common with many other indices, gave back about one half of the day's gains in the last hour of trading.
As previously suggested, the long-term view of this index provides perhaps better insights to key strategic support levels than the equivalent chart for the S&P 500.
Using the monthly chart below, it is possible to identify two levels of chart support both at the 350 level and below that and extending back to 1996 at the 325 level.
One notable feature on the lower chart segment is the current monthly RSI reading on this index which is the lowest observable on the chart. This not only underlines the severity and rapidity of the recent decline but also points to the likelihood for a relief rally soon to alleviate the drastically oversold condition.
I am suggesting that based upon the chart support levels discussed, this index could be within ten percent of an intermediate-term basing pattern.
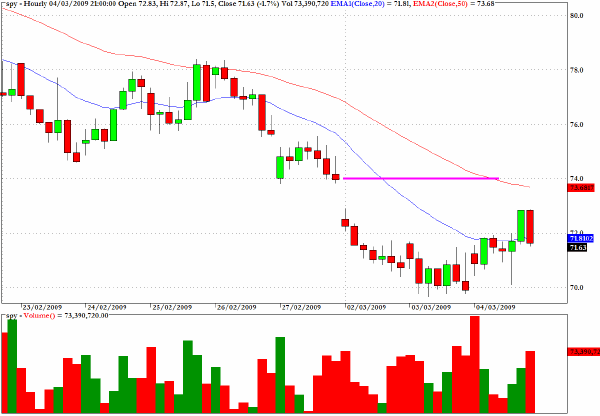
Equity markets got a lift from the prospects of a major Chinese stimulus package announcement as intimated in yesterday morning's commentary. In particular the European markets celebrated the possibility with the DAX posting a five percent plus gain. The US markets too needed little excuse to rally after five consecutive days of losses. But the rally faded later in the session.
This is evident on the hourly chart for SPY and also I have indicated that the 74/5 level for this S&P 500 proxy will be a major hurdle for further recovery efforts.
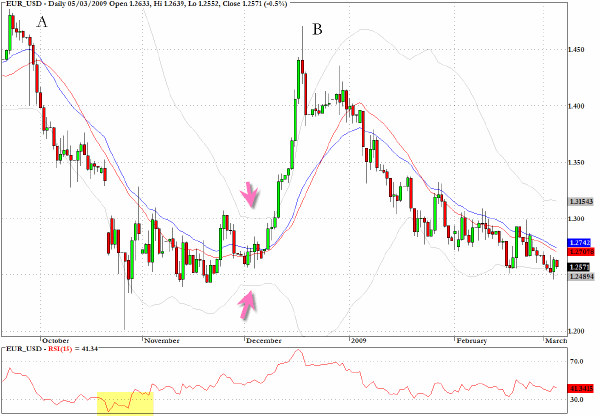
The European Central Bank and the Bank of England will be making announcements today about monetary policy with both expected to cut short term rates by another 50 bps.
The reaction in the currency markets may not be too surprising unless one or other of the banks decides not to follow the market's expectations.
The Euro is still in a slow and steady decline and notably has failed to challenge the 20 or the 50-day EMA's since the blowoff at point B on the chart.
I intend to discuss this chart later during a slot on CNBC's European Closing Bell.
Just while finalizing today's commentary, the Bank of England has cut its base rate to a level of just 50 basis points, which is certainly good news for folks on base rate tracker mortgages but may create some specific profitability issues for the commercial banks. The immediate reaction from European equities has been negative but the markets are now waiting on the decision from the ECB.
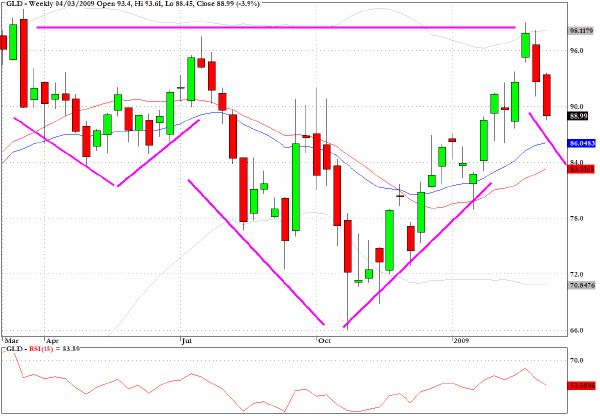
One of the more intriguing patterns is to be found on the weekly chart for the exchange traded sector fund GLD which tracks the spot price of the metal. The price of the ETF approximates to one tenth of the actual spot price.
What is manifesting itself on this chart is a rather convincing case of an inverse head and shoulders pattern where the right shoulder is currently unfolding. The neckline of the chart is to be found around 98, or close enough to the recent attempts to challenge the $1000 spot price.
If the pattern continues to evolve it suggests that the right shoulder could be another few weeks in the making but that a subsequent rally back to the neckline could have substantial momentum and propel the metal to around the $1300 at least.
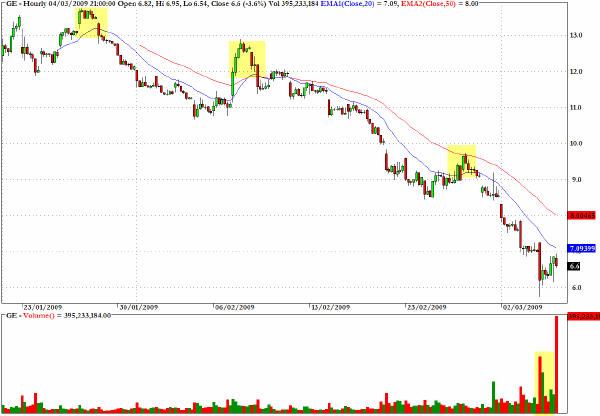
The chart above illustrates just one of the very many structural issues facing the US economy. The hourly chart for Dow component, General Electric (GE) shows a uniform decline over the last month which has seen the price cut in half and - even on a day when stocks are getting a lift - the stock is trading around $6.
The real problem with this company is not dissimilar to the problems being faced by other former behemoths like GM and Citigroup - they strayed too far from their core competence. As distinct from its technology businesses GE has its GE Capital division which is a monstrous headache for the company. This division is suffering along with all of the other companies that just had to be in the forefront of financial wizardry.
There's lots of talk about the board replacing the CEO Mr. Immelt but frankly that's a sideshow.
The CEO cult is dying and by now we should all be waking up to the fact that most of these legends in their own minds have almost wrecked the global economy.
Maybe the stock will get a lift if Mr. Immelt is fired, but until the company figures out what its core business is, chances are that investors will remain very wary.
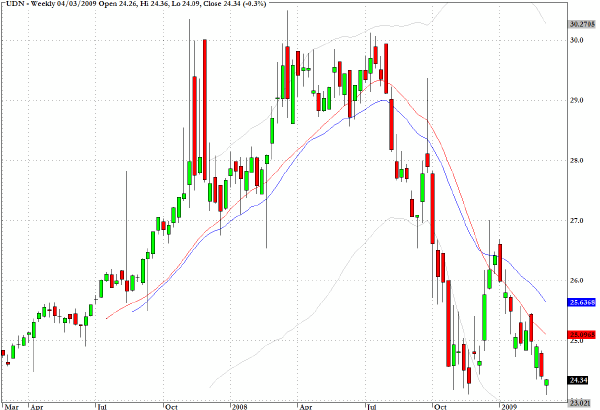
UDN, which takes an inverse position on the US dollar against a basket of major currencies, is approaching previous lows and will be worth monitoring over the next couple of sessions.
I would not suggest taking a position until the impact of today's announcements from the European central banks and also the payroll number for the US have been at least partially digested by traders.
Continued strength in the US dollar, in other words further price erosion in the UDN inverse tracker, would suggest that a more eponymous move lies ahead for the US Currency.
For a rather apocalyptic view of what could turn out to be a stampede for dollars, the following Europe's-banks-face-a-2-trillion-dollar-shortage article is worth reading. Here are a couple of excerpts.
European banks face a US dollar “funding gap” of almost $2 trillion as a result of aggressive expansion around the world and may have difficulties rolling over debts, according to a report by the Bank for International Settlements.
The report, entitled “US dollar shortage in global banking”, helps explain why there has been such a frantic scramble for dollars each time the credit crisis takes a turn for the worse. Many investors have been wrong-footed by the powerful rally in the dollar against almost all currencies, except the yen.
British banks had accumulated a dollar "funding gap" of $300bn by mid 2007. The latest BIS data up to the third quarter of 2008 shows that this exposure has been trimmed by “deleveraging” but it still largely hanging over the UK financial institutions.
Swiss banks had a funding gap of $300bn at the onset of the credit crunch, an extremely high figure relative to Swiss GDP. German banks were $300bn short, and Dutch banks were $150bn short. Belgian and French banks were neutral.
The BIS said the total “funding gap” in dollars was around $2.2 trillion at the peak, when money market liabilities are included. This had fallen to around $2 trillion by the time of the Lehman Brothers collapse. The data is collected with a lag but it appears that there are still huge dollar liabilities to be covered.
Simon Derrick, currency chief at the Bank of New York Mellon, said the implications are obvious. “The global bullion of the last eight years was funded on dollar balance sheets, so the capital destruction we’re seeing leaves banks starved for dollars. Dollar is clearly going to appreciate a lot further,” he said.
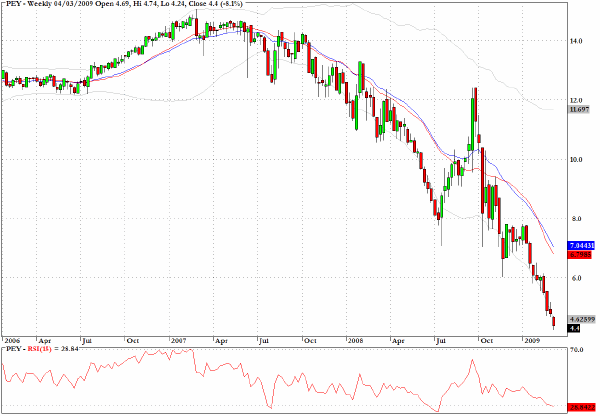
The chart for PEY, which tracks a basket high dividend-yielding US stocks, suggests that investors are becoming convinced that the current dividends being paid by several key companies are in danger of being either slashed or suspended.
This chart is one of the most bearish in a market which has no shortage of eye-catching chart patterns.
Clive Corcoran is the publisher of TradeWithForm.com, which provides daily analysis and commentary on the US stock market. He specializes in market neutral investing and and is currently working on a book about the benefits of trading with long/short strategies, which is scheduled for publication later this year.
Disclaimer
The purpose of this article is to offer you the chance to review the trading methodology, risk reduction strategies and portfolio construction techniques described at tradewithform.com. There is no guarantee that the trading strategies advocated will be profitable. Moreover, there is a risk that following these strategies will lead to loss of capital. Past results are no guarantee of future results. Trading stocks and CFD's can yield large rewards, but also has large potential risks. Trading with leverage can be especially risky. You should be fully aware of the risks of trading in the capital markets. You are strongly advised not to trade with capital.
|