| The Wagner Daily ETF Report For March 5 |
| By Deron Wagner |
Published
03/5/2009
|
Stocks
|
Unrated
|
|
|
|
The Wagner Daily ETF Report For March 5
Stocks broke their five-day losing streak yesterday, providing a much-needed relief rally to investors. The major indices gapped higher on the open, built on those gains in the afternoon, then pulled back into the close. The Nasdaq Composite climbed 2.5%, the S&P 500 2.4%, and the Dow Jones Industrial Average 2.2%. The small-cap Russell 2000 and S&P Midcap 400 indices rallied 2.9% and 3.0% respectively. Showing a bit of weakness into the close, the main stock market indexes finished just above the middle of their intraday ranges.
One disappointing element of yesterday's action is that higher volume failed to accompany the rally. Total volume in the NYSE receded 5%, while volume in the Nasdaq was 4% lighter than the previous day's level. Higher turnover would have pointed to buying interest among mutual funds, hedge funds, and other institutions, but the lighter volume tells us institutional traders were not that active yesterday. Still, volume at least remained above 50-day average levels. In the NYSE, advancing volume exceeded declining volume by a margin of 5 to 2. The Nasdaq adv/dec volume ratio was positive by nearly 5 to 1.
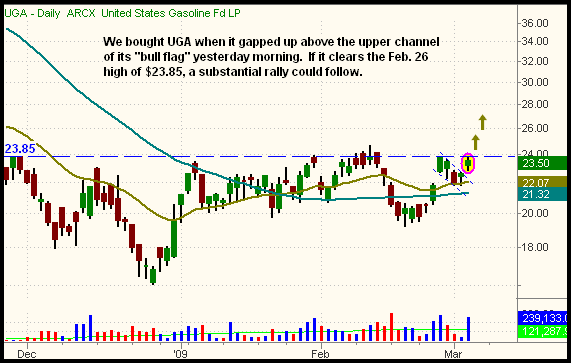
The bullish setup in U.S. Gasoline Fund (UGA), illustrated in yesterday's newsletter, triggered for buy entry by gapping up above the upper channel of its "bull flag" pattern. It's also positive that volume came in at double its average level. If UGA clears the February 26 high of $23.85, a subsequent breakout above the multi-month band of consolidation should follow shortly thereafter -- good news for your trading account, bad news for filling up your automobile!

In yesterday's commentary, we looked at the short-term resistance levels the S&P 500 may encounter on any rally attempt. Just to refresh your mind, the 745 - 750 level (prior lows from November 2008) will be the first substantial test of resistance. Beyond that, the 20-day exponential moving average will provide key resistance at the 770 to 775 area. If the stock market manages to build on yesterday's gains, keep a close eye on the performance of your positions as the S&P 500 approaches these areas of resistance. If you're sitting with losing long positions you want to get rid of, consider selling into strength if the S&P 500 stalls at those levels.
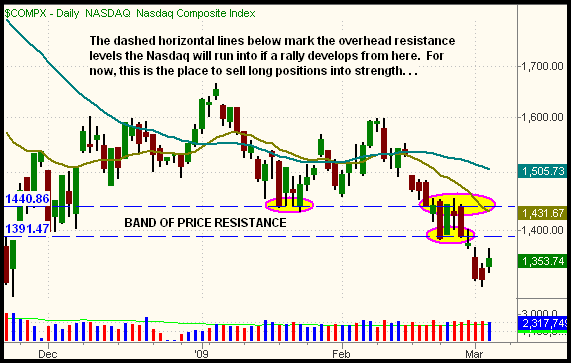
Although the Nasdaq Composite is still above its November 2008 lows, it too has clear areas of overhead price resistance to contend with. The dashed horizontal lines on the chart below mark those areas of resistance:

Presently, we're long a smaller than average position of Nasdaq 100 Index (QQQQ), which we bought on March 3. While most of the trades in this newsletter are "trend trades," such as DGP or SLV, we sometimes supplement our style with the occasional momentum trade -- many of which are very quick, counter-trend bounces or declines. We certainly are not calling a bottom with this position; rather, because of the vast amount of overhead resistance levels, we entered QQQQ as a quick, counter-trend bounce that we plan to sell into resistance in a few days. Our target area is a bounce into resistance of the 20-day MA (approx. $28.50), at which point we'll re-assess conditions to consider whether or not to re-enter the short side of the market. With an entry of $27.00, and a stop of $26.29 (below the March 3 low), we've still got a positive reward-risk ratio of 2 to 1 on this very short-term play.
Open ETF positions:
Long - DGP, QQQQ, UGA
Short - (none)
Deron Wagner is the Founder and Head Trader of both Morpheus Capital LP, a U.S. hedge fund, and Morpheus Trading Group, a trader education firm launched in 2001 that provides daily technical analysis of the leading ETFs and stocks. For a free trial to the full version of The Wagner Daily or to learn about Wagner's other services, visit MorpheusTrading.com or send an e-mail to deron@morpheustrading.com.
|