| The McMillan Options Strategist Weekly |
| By Lawrence G. McMillan |
Published
03/6/2009
|
Options
|
Unrated
|
|
|
|
The McMillan Options Strategist Weekly
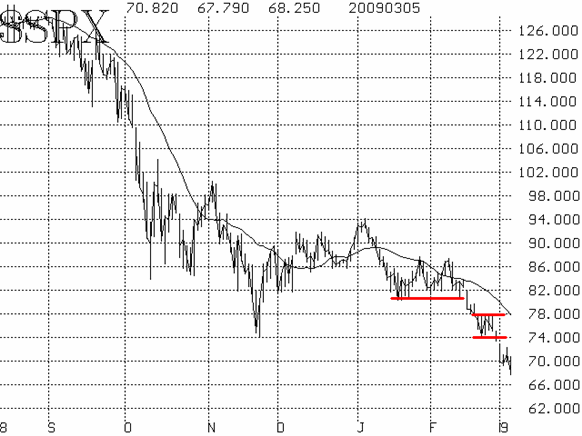
When $SPX broke down through the multiple support level at 805- 810, it unleashed a torrent of selling that is still going on. The selling isn't all technical, of course, as the news out of Washington is being interpreted as so unfriendly to Wall Street that it's poured fuel on the fire. The result is a deeply oversold market (in terms of breadth and other traditional technical indicators). However, sentiment indicators have not followed suit. It's unclear what has possessed so many traders to try to fight this decline -- to bottom fish, to ignore breaking support levels, and to refuse to panic. Regardless, it has now reached proportions where a washout will probably be needed to form a bottom much as we had in November. That bottom was only an intermediate-term bottom and the next one may be, too.

At this time, $SPX is trading well below its 20-day moving average, which makes it "oversold." Oversold rallies often bounce up to the declining 20-day moving average, which is currently at about 780. There is also fairly heavy resistance in the 740-780 area. When the 740 level was breached on February 27, that released the worst selling. Perhaps it came so swiftly that it caught traders by surprise, and that is why they haven't turned to traditional protective methods in reaction.

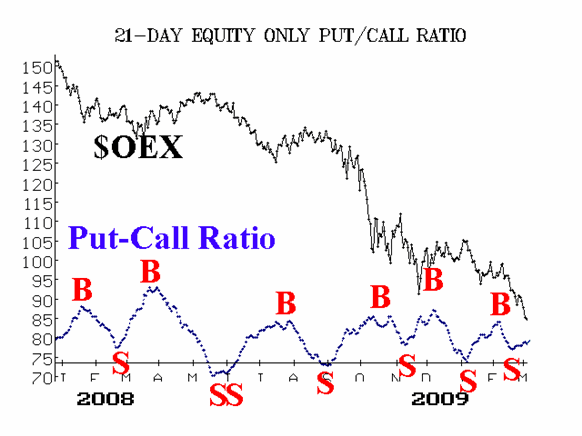
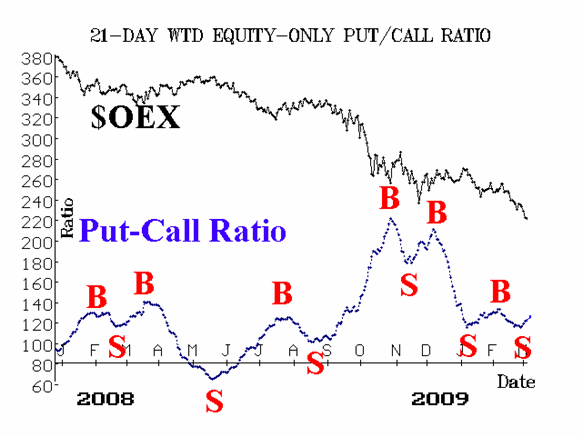
One of those traditional methods would be to buy puts, but the equity-only put-call ratios are languishing near the middle of their charts. They are on sell signals, but the ratios are hardly racing upwards as they would normally do in a major decline. It turns out that put volume actually peaked back on February 6! That seems ludicrous, but it is true. Traders have not felt the need to rush in and buy puts even as the market is disintegrating. That's complacency!

Market breadth is extremely oversold. With breadth this oversold, sharp but short-lived rallies are to be expected. It would likely take about three days in which advances lead declines to generate buy signals from these breadth oscillators.

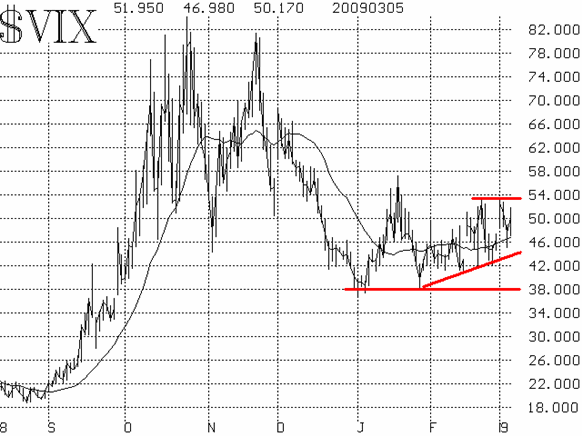
Volatility indices ($VIX and $VXO) reflect similar characteristics. Both are neutral -- mired in trading ranges, and they have not spiked upwards in a show of panic as they always do. This is because traders have not seen the need to pay up for $SPX puts (whose premium "drives" the $VIX calculation). These declines usually end the same way -- with traders finally panicking and $VIX spiking higher. A spike peak in $VIX would be a buy signal.
In summary, expect large counter-trend rallies. But until we see some capitulation in the sentiment indicators, we don't envision an intermediate-term bottom.
Lawrence G. McMillan is the author of two best selling books on options, including Options as a Strategic Investment, recognized as essential resources for any serious option trader's library.
|