| Corcoran Technical Trading Patterns For March 9 |
| By Clive Corcoran |
Published
03/9/2009
|
Stocks
|
Unrated
|
|
|
|
Corcoran Technical Trading Patterns For March 9
I am struck by the number of analysts and pundits that are using inadequate sample sizes for historical analyses in an attempt to make sense of, and situate, the current crisis into a larger context. It is quite common to find articulate discussions in blogs about the fact that stocks are cheap, that we have already reverted to the mean (what mean means exactly is not always specified), that this index is oversold etc. and then to point to data from the last 40/50 years in support of some highly confident market call.
The problem with the current situation is that it is unprecedented and even if one was to extend the historical data sample size to cover the last 100 years (where it is available) this would not really provide any reliable guidance as to where we might expect the bottom and what shape the recovery is going to be.
I commented on CNBC's European Closing Bell last Thursday that the extremely low RSI value on the Russell 2000 index - to take just one example - not only illustrates that we are technically in uncharted territory (sorry to state the obvious) but that the likelihood of an intermediate term rally is mounting. Such a view can only be based on an intuitive probability and I am very reticent to take a firm view at this point that the end of the bear market is close at hand as some (too many?) are.
With dire economic news and further evidence of financial miscalculations on a gargantuan scale becoming almost an hourly experience this is not the time for being heroically prescient. Bear markets end when no-one is paying attention and not when plenty of analysts were making claims that the employment data released on Friday was the turning point - on what basis I failed to comprehend.
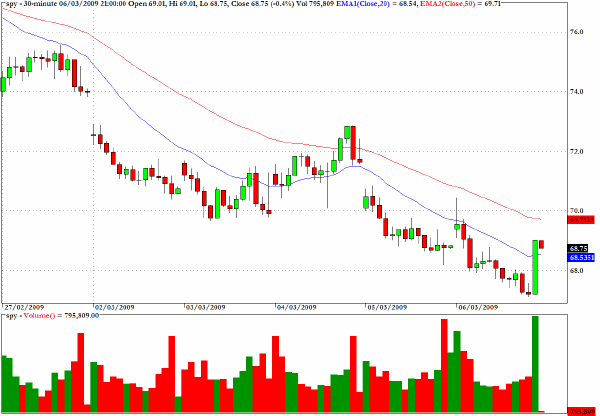
The 15 minute chart for SPY shows some late buying on Friday and some are suggesting that having hit the 680 level we are due for a bounce. Others are pointing to the possibility that the hearings in front of a House Financial Services subcomittee this Thursday to review the issue of "mark to market" accounting could also, if the rule is suspended, at least on a temporary basis, provide an excuse for a very sharp rally.
While that is certainly a possibility it does seem that too many people are expecting a violent short squeeze. Should the committee suspend M2M there would be a relief rally but the magnitude may not be as strong as some are hoping for as my sense is that most recently the majority of the selling has not been fuelled by massive short selling but rather a continuation, even accelerations of,long liquidations from pension funds and insurance companies.
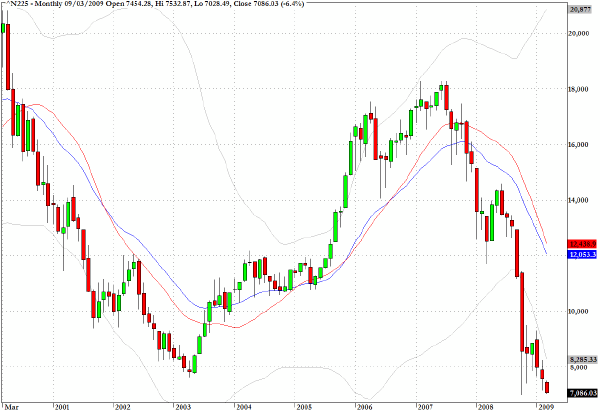
The Nikkei 225 just managed to close above the 7000 level in trading on Monday and is now just 1.5% from the intraday lowest level - of 6994 - touched on October 28th and a level not seen in more than 25 years.
The Japanese equity market since 1989 stands as a very sobering testimony to wealth destruction following bubble deflation
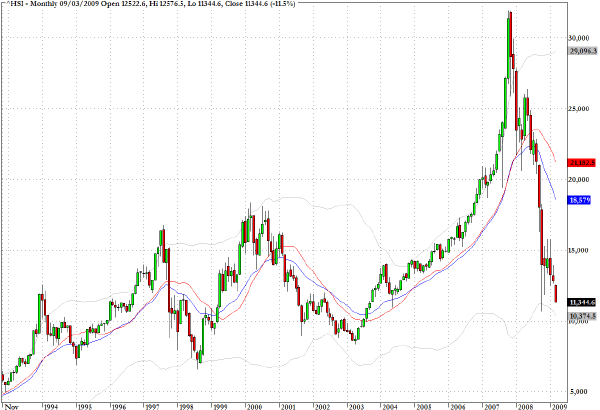
The Hang Seng Index (HSI) dropped by almost five percent and is also approaching the intraday low seen at the end of last October.
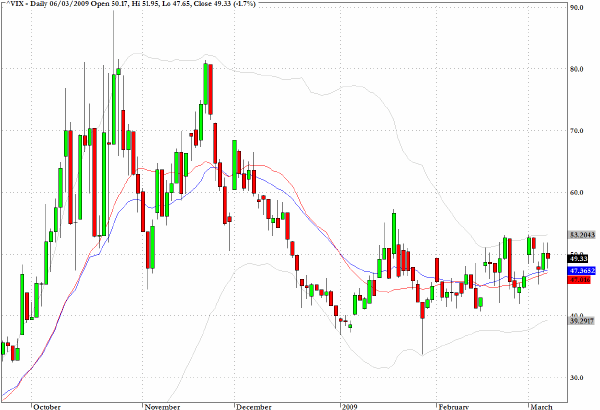
The VIX is becoming less volatile and I touched on some thoughts behind this fact in a posting at my blog site over the weekend.
According to William Dudley who replaced Tim Geithner as the president of the New York Federal Reserve Bank the "deleveraging" process underway in financial markets is not complete. Prior to joining the Fed, Dudley was chief economist at Goldman Sachs. He is quoted as saying that "Hedge fund redemptions have soared and hedge fund assets may fall in half from their peak of about $2 trillion."
The slow and steady unwinding of assets including equities is probably a main factor explaining the phenomenon of the "slow motion crash" which has attracted a lot of commentary. The fact that major financial intermediaries are continuing to reduce leverage through persistent unloading of long held positions in portfolios is almost certainly part of the explanation for the decline in the spikes in the VIX as well.
When leverage was considerably higher in the fall of 2008 there were more anxious sellers of assets owing to the damage being done to P&L's but as the degree of leverage is decreasing so too has some of the seller's anxiety.
But if Mr.Dudley is correct in his assessment that the hedge funds are still unwinding, we should be ready for further deterioration in equity markets while the distribution continues, and this may well occur without causing the VIX to return to the levels seen last October and November.
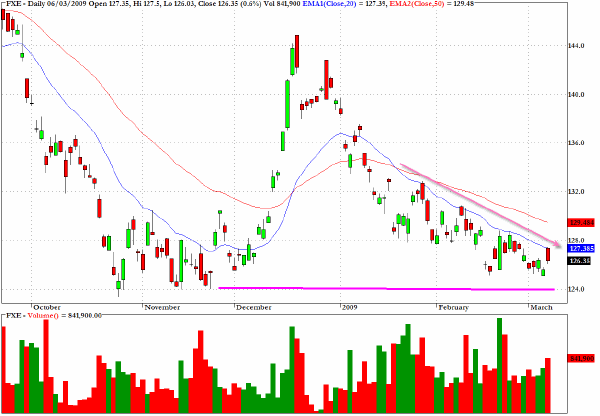
The Euro tried to rally after the weak employment data which was released last Friday but met firm resistance at the descending line which marks the 20 day EMA. Also noticeable on the chart pattern is the descending wedge formation which suggests that a downward break is becoming increasingly likely.
Also notable today is the weakness of sterling which is currently trading at $1.38 or thereabouts. The UK government is walking a very thin line with regard to its ever increasing commitments to the banking sector and a massive fiscal stimulus package and its proposed measures to finance these.
QE is a gamble.
Even if it may provide a present day purchaser of gilts there are plenty of overseas holders of existing UK Treasury issues who may be getting more nervous about long term prospects for sterling and sovereign credit risk.
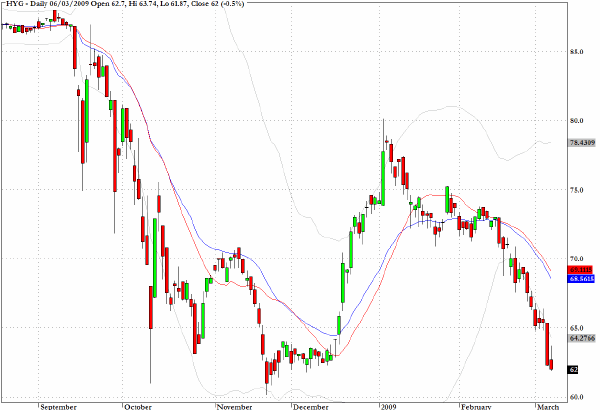
HYG, which tracks the high yield corporate bond market has returned to the distressed levels seen last fall as suggested here at the beginning of last week.
At this stage I would suggest stepping aside but the sector could be worth another look if M2M is suspended.
Clive Corcoran is the publisher of TradeWithForm.com, which provides daily analysis and commentary on the US stock market. He specializes in market neutral investing and and is currently working on a book about the benefits of trading with long/short strategies, which is scheduled for publication later this year.
Disclaimer
The purpose of this article is to offer you the chance to review the trading methodology, risk reduction strategies and portfolio construction techniques described at tradewithform.com. There is no guarantee that the trading strategies advocated will be profitable. Moreover, there is a risk that following these strategies will lead to loss of capital. Past results are no guarantee of future results. Trading stocks and CFD's can yield large rewards, but also has large potential risks. Trading with leverage can be especially risky. You should be fully aware of the risks of trading in the capital markets. You are strongly advised not to trade with capital.
|