| Corcoran Technical Trading Patterns For March 11 |
| By Clive Corcoran |
Published
03/11/2009
|
Stocks
|
Unrated
|
|
|
|
Corcoran Technical Trading Patterns For March 11
It was indeed a turnaround Tuesday, and several factors - primarily the fact that the market had been down so many sessions that a bounce was overdue - conspired to produce exactly the rally in the financials that many have been anticipating.
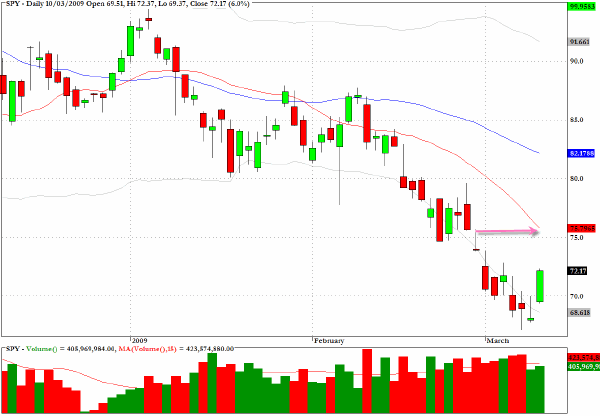
SPY failed to deliver high volume on the rally but one should not detract from the long green candlestick which is still impressive.
The 75 level on the SPY proxy seems like a feasible target in the near term.
It is worth noting that news from Citigroup (C) was cited as one of the triggers for yesterday's rally. Apart from the fact that the bank simply said that it had been able to make some profit in January and February - wow - isn't that what banks are supposed to do - the peculiarities of the way that the Dow Jones Industrials is calculated resulted in just a miniscule contribution to the DJIA surge.
As noted by another commentator, Citigroup rose the grand total of 40 cents per share -- which means that its contribution to the 379-point rise in the Dow was a whopping 3 points.
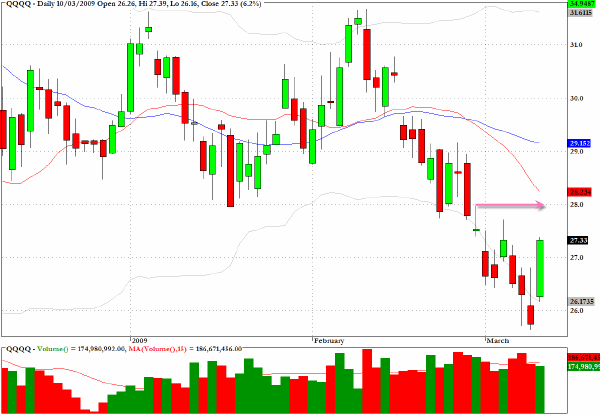
The Nasdaq 100 index (NDX), after reaching a multi-year low in Monday's session, reversed with a strong rally of 6.6%. In terms of the cash index, there are resistance points at 1140 and even firmer hurdles at 1185.
The exchange traded proxy for the index, QQQQ, once again reveals the fact that the volume on the large price move yesterday was somewhat underwhelming and that this proxy should meet quite serious resistance around the $28 level.
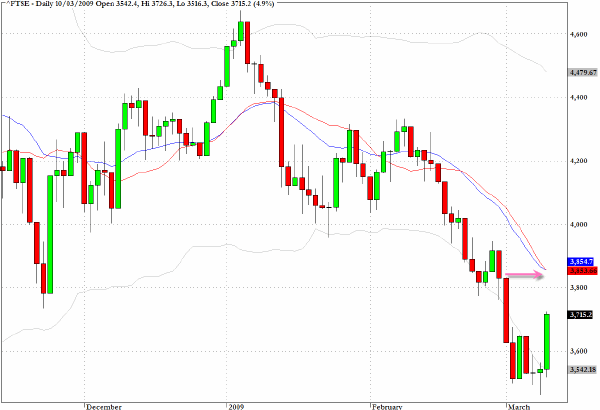
All of the European indices enjoyed large moves yesterday, and since the European closes came while the US indices still had much further to rise there is an expectation that there is still scope for further upward movement in today's session.
The FTSE in the UK will find, however, that the 3850 level provides quite a hurdle as both the 20 and 50-day EMA's have converged there.
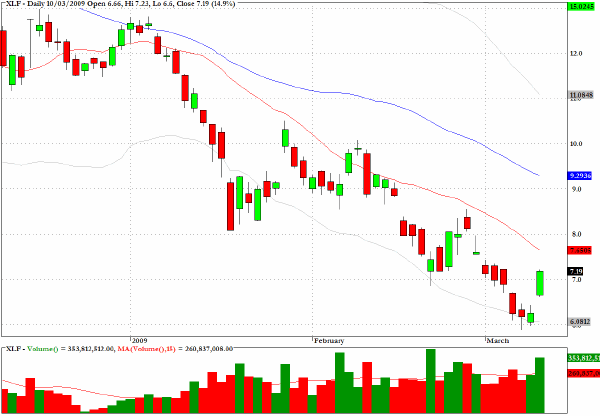
Readers may recall that I have, on several occasions recently both in this column and also on CNBC, pointed to the fact that despite poor performance there was a strong case building that the financials, and specifically the banking sector, had seen their momentum bottom.
The positive MACD divergences can persist for some time before a sector or index will exhibit the kind of powerful price recovery which was witnessed yesterday. However, seen in the larger context of the ongoing price deterioration, this sector fund has plenty of room to go before the descending trend line pattern is broken; and the presumption must still be that, while the worst of the selling may be over, the recovery could be very slow and tentative.
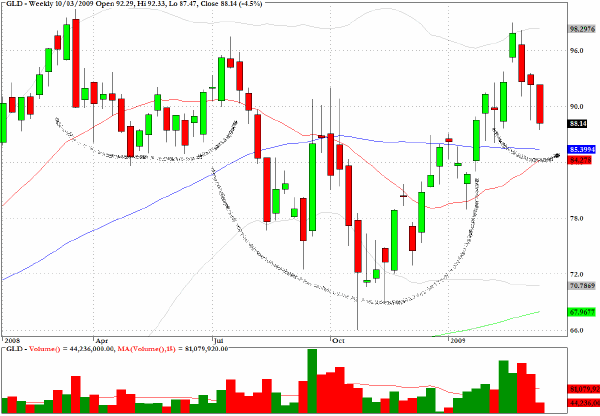
Gold sold off quite severely yesterday as the chart for the ETF which tracks the precious metal, GLD, reveals.
I shall simply restate my view from last week that on the weekly chart, as seen below, the inverse head and shoulders pattern is still unfolding as anticipated and I would be a buyer of the metal around $850 per ounce, but not anxiously so at this stage.
If the shoulder pattern continues to evolve as expected there could still be some time to go while the pattern evolves. A break of the 980 neckline could see the metal move quite quickly to $1300, in my opinion.
Clive Corcoran is the publisher of TradeWithForm.com, which provides daily analysis and commentary on the US stock market. He specializes in market neutral investing and and is currently working on a book about the benefits of trading with long/short strategies, which is scheduled for publication later this year.
Disclaimer
The purpose of this article is to offer you the chance to review the trading methodology, risk reduction strategies and portfolio construction techniques described at tradewithform.com. There is no guarantee that the trading strategies advocated will be profitable. Moreover, there is a risk that following these strategies will lead to loss of capital. Past results are no guarantee of future results. Trading stocks and CFD's can yield large rewards, but also has large potential risks. Trading with leverage can be especially risky. You should be fully aware of the risks of trading in the capital markets. You are strongly advised not to trade with capital.
|