| Corcoran Technical Trading Patterns For March 12 |
| By Clive Corcoran |
Published
03/12/2009
|
Stocks
|
Unrated
|
|
|
|
Corcoran Technical Trading Patterns For March 12
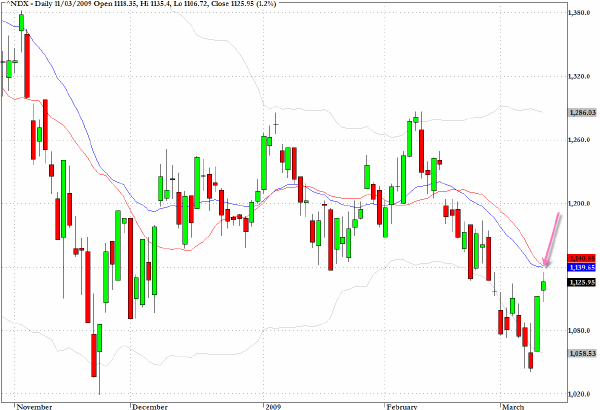
The followthrough to Tuesday's big rally was muted, to put it simply. Equities got off to a good start but as the session wore on there seemed to be little appetite to stretch further towards some clear overhead resistance.
The chart for Nasdaq 100 (NDX) shows quite clearly that this index will confront the combination of two major moving averages which have converged around 1140 as well as a previous support level which could now be construed as a resistance layer.
In general in reviewing the charts presented today there are a lot of descending wedge patterns across a variety of asset classes which suggests that deflationary pressures are still very much alive and well.
The quote of the week (so far) must surely be from Tim Geithner who was interviewed on a US TV show and expressed the current challenge of how to counter these deflationary forces with these inimitable words.
"There’s capital that wants to come into the system, but it just can’t get financing".
In a sentence, there truly is the Enigma (i.e. smoke and mirrors) of Modern Finance.
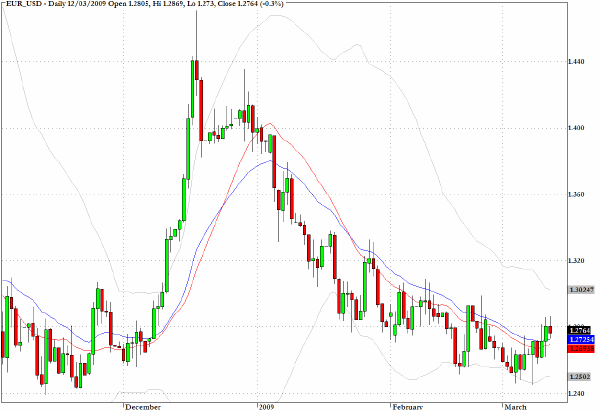
The Euro has been drifting just above the fairly critical $1.25 level for several sessions and although I have not drawn the descending wedge pattern it is quite easy to visualize it from the December high and tracking the 20-day EMA.
I continue to monitor this cross rate because there is still the possibility that the Eurozone currency could find support and move higher, but I would maintain that while the drift continues asset allocators are more preoccupied with global credit concerns (including the Eastern European crisis) than with moving aggressively into equities.
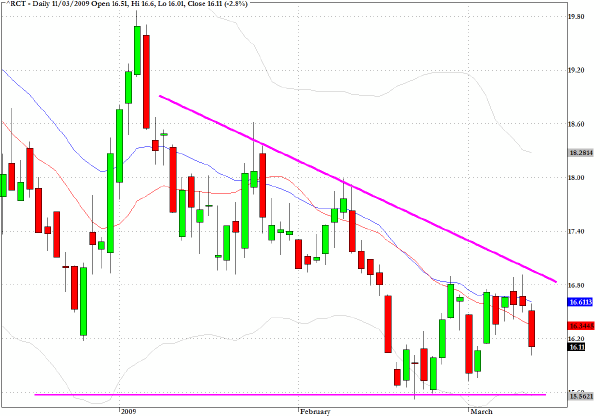
Commodities are still failing to get a sustained bid as reflected in the chart pattern for the Rogers Commodity Index (RCT).
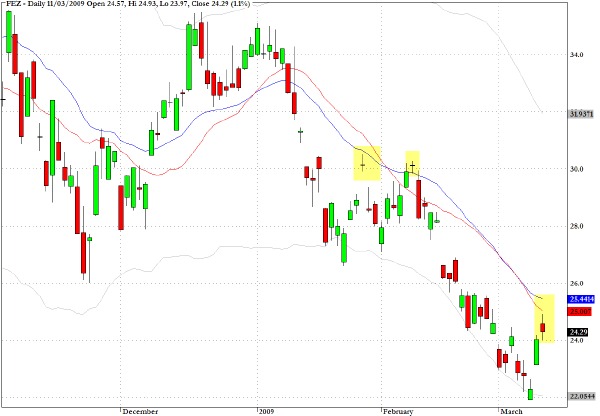
As I am writing this commentary the European markets are selling off with the DAX down more than 2.5%.
The exchange traded fund FEZ tracks the Eurostoxx 50 index, and as the chart pattern suggests, this index is struggling itself to break out of the bearish triangular formation. Poor results from a number of companies including BMW, Bulgari will weigh on this fund when it opens for trading later today in New York.
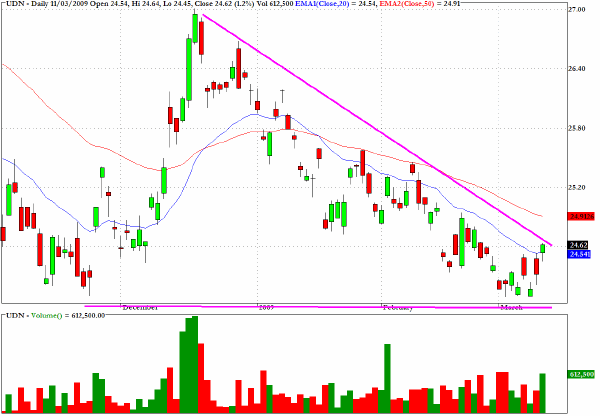
The most interesting of the descending wedge patterns is to be found on the UDN chart which is an inverse tracker for the US dollar against a bundle of major currencies. The fund is currently challenging the descending slope line and, should we see a clear breakout, this would suggest that the recent trend for US dollar strength may be diminishing. This would, in turn, be another supporting factor for a continuation of the bear market rally in equities.
However for now, until proven otherwise, the larger framework for this pattern suggests that the US currency is still benefitting from de-leveraging and a dollar shortage as fund managers repatriate assets to dollar-denominated domiciles.
Clive Corcoran is the publisher of TradeWithForm.com, which provides daily analysis and commentary on the US stock market. He specializes in market neutral investing and and is currently working on a book about the benefits of trading with long/short strategies, which is scheduled for publication later this year.
Disclaimer
The purpose of this article is to offer you the chance to review the trading methodology, risk reduction strategies and portfolio construction techniques described at tradewithform.com. There is no guarantee that the trading strategies advocated will be profitable. Moreover, there is a risk that following these strategies will lead to loss of capital. Past results are no guarantee of future results. Trading stocks and CFD's can yield large rewards, but also has large potential risks. Trading with leverage can be especially risky. You should be fully aware of the risks of trading in the capital markets. You are strongly advised not to trade with capital.
|