| Corcoran Technical Trading Patterns For March 18 |
| By Clive Corcoran |
Published
03/18/2009
|
Stocks
|
Unrated
|
|
|
|
Corcoran Technical Trading Patterns For March 18
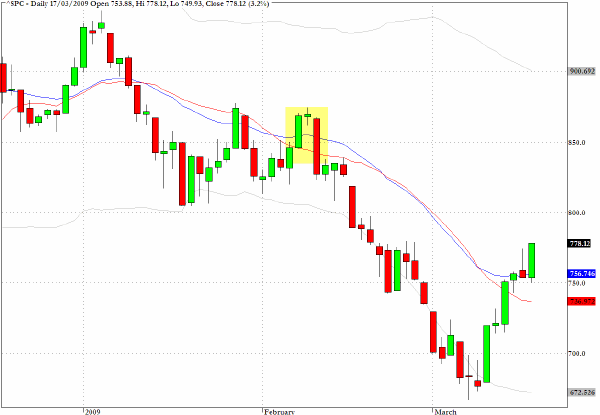
The rally in equities came back with renewed vigor during yesterday's session. In the latter part of the afternoon session there were the beginnings of a pullback after the S&P 500 reached back to challenge Monday's intraday high, but the bulls kept up the buying pressure and the index kept moving higher into the close.
It must be said that the last week or so has provided some excellent profit opportunities on the long side with broad indices cooperating with double digit gains but with certain really beaten down stocks providing, in some cases, triple digit gains. It has been a good time to be opportunistic but, as the old saying goes, most of the low hanging fruit may have been harvested already.
Reverting to the S&P 500 charts, the intraday trading pattern is one of a trend day, which is a pattern discussed in detail in my book Long/Short Market Dynamics. The one proviso that needs to be stipulated in regarding to trend days is that they often occur in clusters and it is not uncommon for them to be accompanied by reversal sessions in which the alternate trend comes into play.
I maintain my intermediate term target of 825 for the S&P 500 but would not expect us to get there without some choppy trading as we move into the 800 zone.
Readers may be interested to know that I am now well into the writing of a new book which will be focused on the shortcomings of traditional macro-economics in anticipating and understanding financial crises and how certain insights from the technical conditions of markets greatly enhances that understanding.
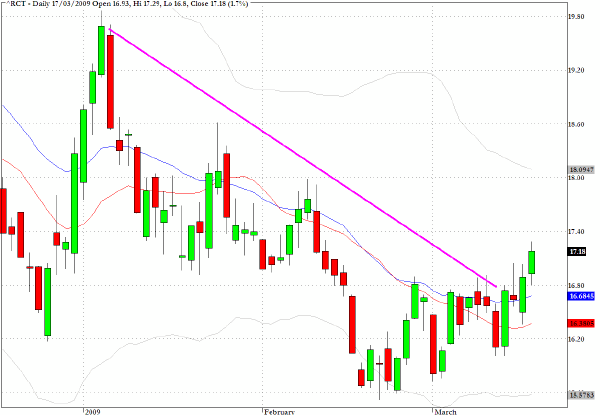
In one of last week's columns I featured the daily chart for the Rogers Commodity Index (RCT) and commented that the descending wedge pattern was still intact and encouraging the view that deflationary forces were still very much in evidence.
Over the course of the last two weeks, along with sustained buying from the bulls with respect to equities (aided by a diminution in the activities of the short sellers), and with many, perhaps too many, starting to talk in terms of getting ahead of the recovery when it comes, there has been a change in the complexion of the chart for a broad range of commodities.
Despite evidence that aluminum and steel are moribund industries at present, the future discounting mechanism that drives markets is pointing to a possible early recovery play in parts of the commodity markets.
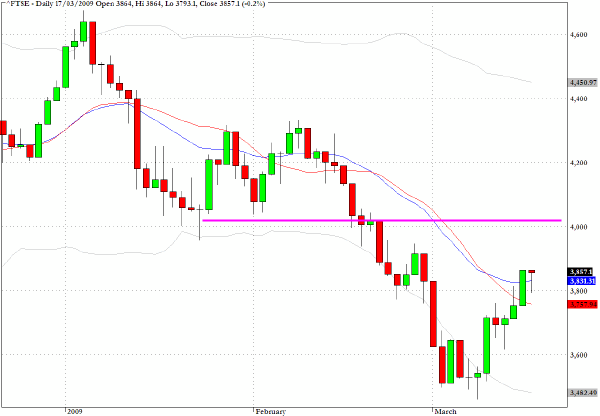
The UK's FTSE seems destined to tackle 4000 in coming sessions but it may run into severe resistance at this pivotal level with many trading desks deciding that this is a good time to book the rather exceptional short term profits that have been available over the last few sessions.
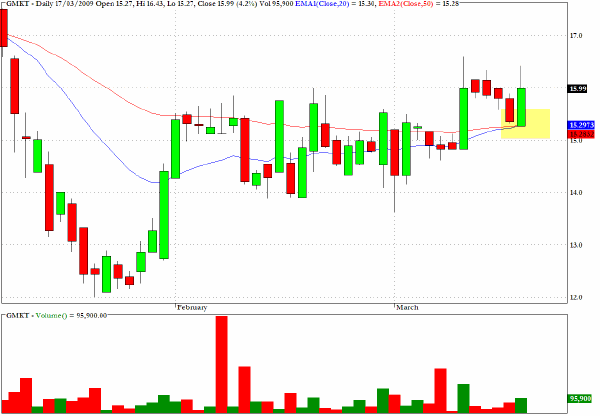
Here is one of my comments from Monday's letter.
Gmarket (GMKT) has an evolving bull flag pattern but could retrace further towards the moving average support.
Purchasing during Monday's session at or near to the moving averages, or even on Tuesday's open could have returned more than five percent during yesterday's session.
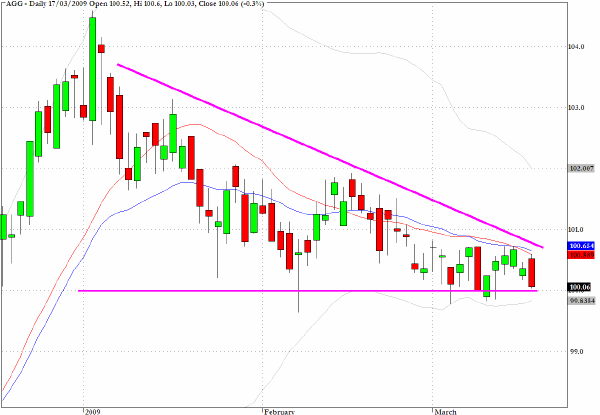
AGG, which tracks the iShares Lehman Aggregate Bond Index, seems unable to make any progress and is nestling further into the downward wedge pattern.
It would not be on my short list at present but a further drop below the baseline would suggest further slow price erosion.
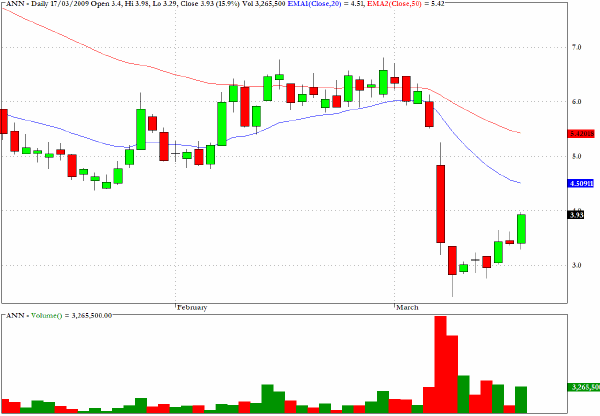
Ann Taylor (ANN) will be worth monitoring in today's session for entry opportunities on the short side.
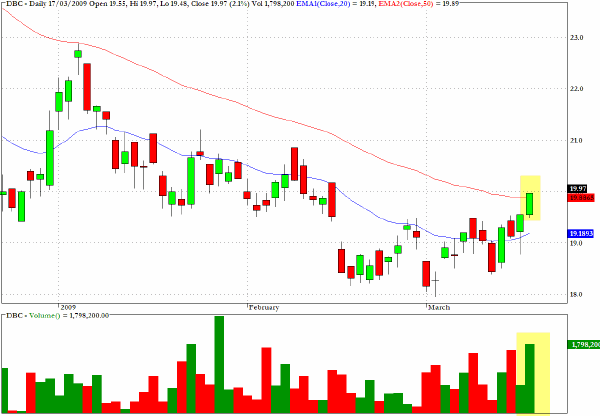
DBC could be worth a play on the long side as it has the most bullish chart among some of the available exchange traded funds in the commodities arena.
Clive Corcoran is the publisher of TradeWithForm.com, which provides daily analysis and commentary on the US stock market. He specializes in market neutral investing and and is currently working on a book about the benefits of trading with long/short strategies, which is scheduled for publication later this year.
Disclaimer
The purpose of this article is to offer you the chance to review the trading methodology, risk reduction strategies and portfolio construction techniques described at tradewithform.com. There is no guarantee that the trading strategies advocated will be profitable. Moreover, there is a risk that following these strategies will lead to loss of capital. Past results are no guarantee of future results. Trading stocks and CFD's can yield large rewards, but also has large potential risks. Trading with leverage can be especially risky. You should be fully aware of the risks of trading in the capital markets. You are strongly advised not to trade with capital.
|