| Corcoran Technical Trading Patterns For March 19 |
| By Clive Corcoran |
Published
03/19/2009
|
Stocks
|
Unrated
|
|
|
|
Corcoran Technical Trading Patterns For March 19
The FOMC surprised the markets yesterday with its implementation of the Brave New World of Quantitative Easing. The Federal Reserve will expand its balance sheet by more than a trillion dollars and will be buying, over and beyond its current substantial holdings, a further $750 billion of mortgage-backed securities, $300 billion of long dated Treasuries, another $100 billion of agency related debt, and an expansion of the eligible collateral to almost certainly include some even more dodgy paper that will be quietly leaked into the market via hedge funds who become private partners in the ongoing financial chicanery that is the TALF.
The implications for the financial economy are far reaching and this was witnessed across the spectrum of asset classes as the charts below reveal.
Will it all work? Nobody knows - but it is a massive gamble and raises the specter of a dollar crisis and an eventual major hit to the Fed's balance sheet when all of these low-yielding Treasuries have to be unloaded into a market in the future where inflation may be a big issue and long-dated bonds with 2% coupons will look extremely unattractive.
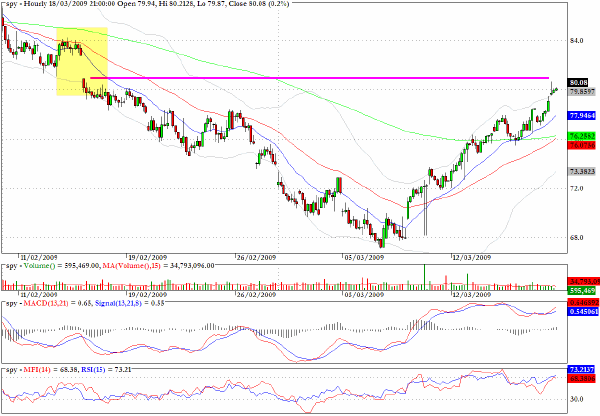
Equities and the S&P 500 celebrated the news with an immediate rally after the FOMC statement that took the index above 800. There was a retreat into the close but the mood seems set to endure, and the 825 which I have targeted now could be done in the next few sessions.
The long-term hourly chart for the SPY proxy clearly reveals how the index has moved back exactly to the level following the gap down (highlighted in yellow) which took place on February 17. There could be a struggle during today's session to regain the pre-gap levels and assuming this hurdle will be overcome there should be even stiffer resistance in the vicinity of 84 on the SPY proxy which corresponds to the 830 area on the cash index.
Given the rather large implications of yesterday's move, it will be good to re-evaluate the next likely target at the beginning of next week.
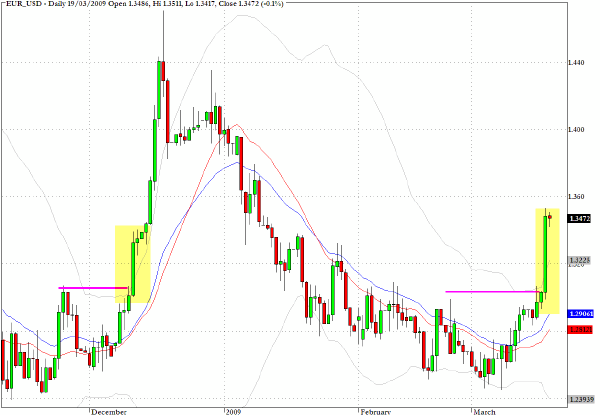
The Euro shot up after the FOMC announcement in a move that echoed the move in early December when the Fed dropped the fed funds rate to effectively zero. Clearly some large forex players are sending a clear message to the Fed that they are nervous about the longer-term consequences of the new QE policy. One has to wonder whether some of the selling of the US currency yesterday was coming from the Chinese central bank to underline the concerns expressed by Premier Wen last week about his country's exposure to US dollar-denominated Treasuries.
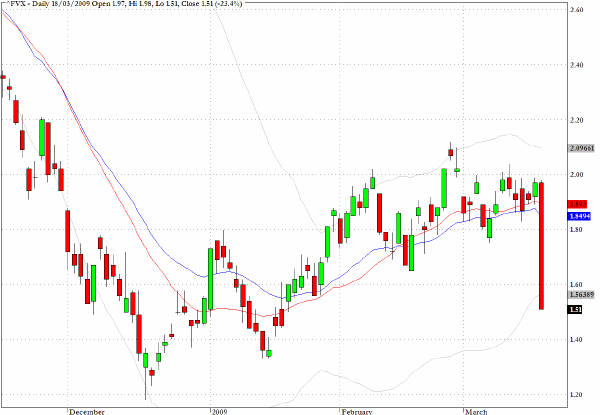
Yields on long-dated Treasuries dropped dramatically after the FOMC statement and the largest percentage change in yields was seen at the five-year maturity with a 23% drop in the yield to 1.5%.
As is evident from the chart below, the clear uptrend which has been in place since the unprecedented basing which took place in mid-December has now been thoroughly violated, and the FOMC statement makes it pretty clear that yields will be pushed lower as the Fed expands its balance sheet.
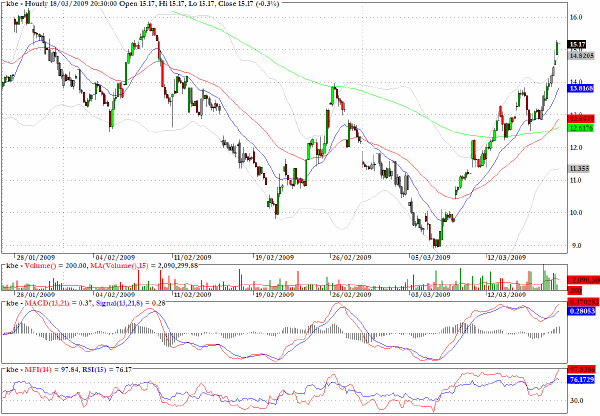
The exchange traded fund for the KBW Banking Index (KBE) has moved up almost without hesitation since the bottom on March 6. As the hourly chart suggests there is a lot of price congestion at the 16 level and the traders who have been riding this parabolic ascent may be looking to digest some of these gains.
I was early on calling the momentum bottom for the banks but frankly have been surprised by the strength of the recovery. At some point the large funds will have covered their short positions and then it will be a matter of how large is the appetite from the insurance companies and pension funds for moving back into the banks. They may not be as ardent as some are anticipating.
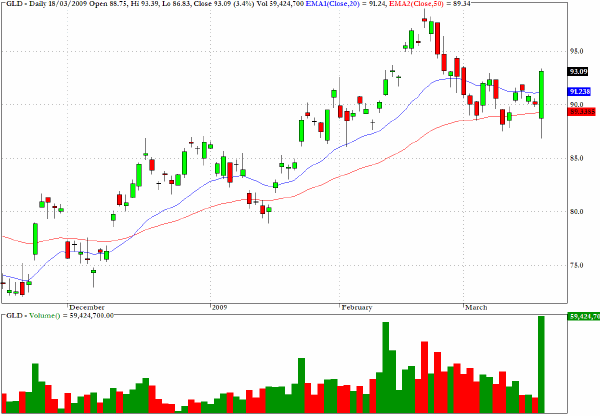
One of the most spectacular reactions to yesterday's FOMC decision was seen in the precious metals, in particular with gold. The ETF which tracks the spot price of the metal, GLD, staged a massive reversal and as the very large green candlestick on very heavy volume suggests there are many traders that are sensing the growing inflationary threat - over the longer term - of the QE policy.
A couple of weeks ago I expressed the view that the gold chart is tracking the evolution of an inverse head and shoulders pattern with a possible neckline break of the $1000 level leading quickly to $1350.
With yesterday's move the pattern is still unfolding along those lines and even a pullback towards yesterday's lows would, if not seriously violated, lend further conviction to the pattern.
Clive Corcoran is the publisher of TradeWithForm.com, which provides daily analysis and commentary on the US stock market. He specializes in market neutral investing and and is currently working on a book about the benefits of trading with long/short strategies, which is scheduled for publication later this year.
Disclaimer
The purpose of this article is to offer you the chance to review the trading methodology, risk reduction strategies and portfolio construction techniques described at tradewithform.com. There is no guarantee that the trading strategies advocated will be profitable. Moreover, there is a risk that following these strategies will lead to loss of capital. Past results are no guarantee of future results. Trading stocks and CFD's can yield large rewards, but also has large potential risks. Trading with leverage can be especially risky. You should be fully aware of the risks of trading in the capital markets. You are strongly advised not to trade with capital.
|