| Famous Technical Patterns |
| By Price Headley |
Published
03/22/2009
|
Currency , Futures , Options , Stocks
|
Unrated
|
|
|
|
Famous Technical Patterns
Trend followers, momentum traders, and technical analysts are often looking for "tops" and "bottoms" in order to find trend changes. To basically define a top and a bottom -- a top can be seen as the highest point in a stock's uptrend, usually followed by a decline of some sort (that would be also often called a "significant top"). The opposite is true for a bottom, which is the lowest point in a downtrend. You can have double tops/bottoms or triple tops/bottoms when a stock reverses its trend. In the case of a double top, the stock will pull back to support and make another run higher before reversing its trend (a bottom sees the stock test resistance). A triple top contains three runs higher and two pullbacks to support. Many technicians see the more tests of a support/resistance level, the more likely it is to be broken.
Technical analysts will look for specific patterns to indicate the strength or weakness of a stock -- some of which occur time-and-time again and are analyzed by many to be significant. One of those "famous" patterns is known as the head-and-shoulders pattern, so named because of its inclusion of two shoulders and a neckline.
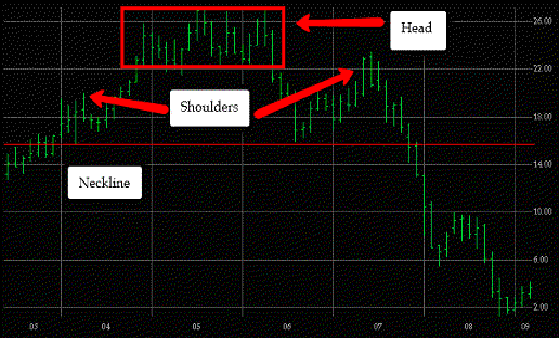
The chart below demonstrates a sample head-and-shoulders formation:
Common Head-and-Shoulders Technical Pattern

The formation is comprised of a neckline, two shoulders (left and right), and a head - giving us the pattern's name. The neckline is created by connecting the low points of each of the shoulders; this level acts as support (or resistance). The head is the highest point, while each of the shoulders are lower than the head (and often in a line with each other).
Notice that this particular head-and-shoulders pattern takes place in the midst of an uptrend, but the opposite can also occur. In a downtrend, the neckline acts as resistance and the head is the lowest point on the chart. This is sometimes called a "reverse" or "upside-down" head-and-shoulders.
Sometimes these formations are labeled head-and-shoulders tops and bottoms or reversals. This occurs if the trend reverses direction after the formation completes. The prior chart is a good example of a head-and-shoulders top. The logic behind the breakdown of this pattern in the above chart is that the stock made signficant top, retraced to a previous lower top, then re-tested a support/resistance level (neckline) -- this is a likely spot for a downside breakdown in the pattern.
Another famous technical pattern is the "cup-and-handle" formation. As you can see on the chart below, this formation consists of a downtrend followed by a side trend then an uptrend. This section forms the cup, which is then followed by a bit of a consolidation downtrend, setting the handle. This is usually perceived to be a pattern that sets up an upside breakout -- but as you can see by the following chart, it can also set up a big momentum down move. The logic behind this is basically that the stock has formed a bullish base, and the handle is the consolidation prior to the breakout.
Common Cup-and-Handle Technical Pattern

Price Headley is the founder and chief analyst of BigTrends.com.
|