| The Wagner Daily ETF Report For March 25 |
| By Deron Wagner |
Published
03/25/2009
|
Stocks
|
Unrated
|
|
|
|
The Wagner Daily ETF Report For March 25
Digesting gains of the previous day's massive rally, stocks gave back a piece of that advance yesterday, but the major indices held above new support of their 50-day moving averages. The broad market opened significantly lower, then oscillated in a sideways range throughout the entire session. The Dow Jones Industrial Average fell 1.5%, the S&P 500 2.0%, and the Nasdaq Composite 2.4%. The Russell 2000 shed 3.9%, but the small-cap index conversely led with an 8.4% gain on Monday. The S&P Midcap 400 lost 2.5%. Selling pressure in the final fifteen minutes of trading caused the main stock market indexes to close at their intraday lows.
One positive aspect of yesterday's session is that the losses occurred on declining volume. Total volume in the NYSE receded 14%, while volume in the Nasdaq was 9% below the previous day's level. Yesterday's lighter turnover on the pullback was an important element to the sustainability of the current rally; another day of institutional selling (aka "distribution day") would have been bearish. In the NYSE, declining volume exceeded advancing volume by a margin of nearly 5 to 1. The Nasdaq adv/dec volume ratio was negative by just 3 to 1.
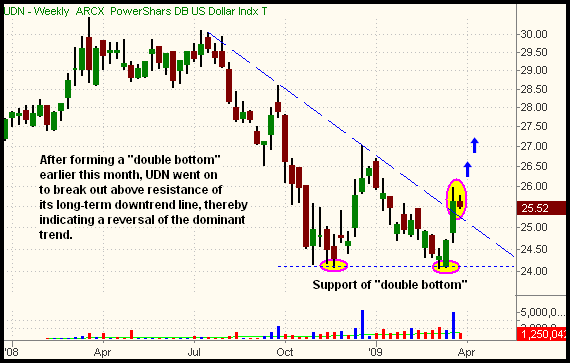
After trending higher throughout all of 2009, the U.S. dollar recently reversed course, sparked by last Wednesday's announcement that the Fed would begin buying $300 billion in long-term U.S. treasuries. Since then the dollar has tried to recover from its large March 18 drop, but has been unable to make much headway. This swift trend reversal has created a potential buying opportunity in PowerShares U.S. Dollar Bearish Fund (UDN), which moves higher as the value of a basket of foreign currencies gains against the U.S. dollar. Below, the weekly chart shows that UDN has reversed its long-term downtrend. The shorter-term daily chart that follows illustrates the potential buy point in the coming days:


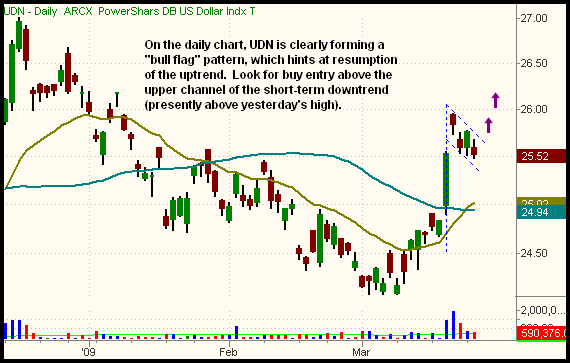
On the daily chart, we've annotated the "bull flag" pattern that has developed. This pattern, which indicates a likelihood of an upward trend resumption, is buyable when the price of UDN rallies above the upper channel of the ultra short-term downtrend from the March 19 high. That correlates to a buy entry just above yesterday's high of $25.68. A protective stop can be neatly placed below the 20 and 50-day moving averages, just below the $25 level and the March 18 low. If trading UDN, be sure to adjust your share size to compensate for its rather low volatility and ATR (average true range).
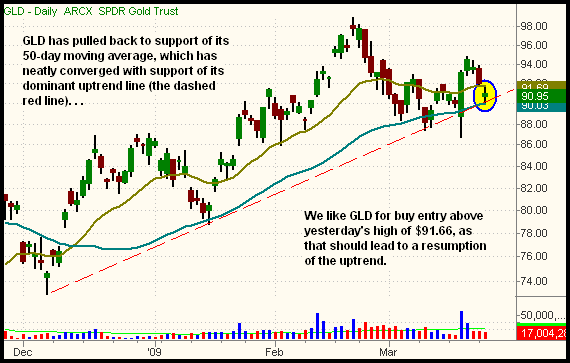
As the dollar sold off last Wednesday, SPDR Gold Trust (GLD) rocketed higher. Since then, it has drifted lower, but is now trading at support of its 50-day MA, which has perfectly converged with its primary uptrend line. This creates an ideal buying opportunity in GLD (or DGP if you prefer the leveraged flavor of gold), right above yesterday's high of $91.66. Just be sure not to "jump the gun" by buying GLD before it moves above yesterday's high. The buy setup in GLD is shown below:

When the stock market scores a monstrous rally, as it did on Monday, professional traders closely observe whether or not the major indices surrender any of those gains the following day. If stocks do pull back, the key point is by what percentage. Although stocks lost approximately 2% yesterday, the losses were not that large considering the degree of the previous day's advance. The S&P 500 and Dow Jones Industrials both retraced about 25% of Monday's gains, while the Nasdaq Composite retraced to the 38.2% Fibonacci retracement level. More importantly, all the indexes held above their 50-day moving averages, an area of resistance that stocks have been unable to hold above in recent months. As long as the 50-day MAs hold up, and we don't see a session of higher volume selling, both the short and intermediate-term trends remain "up."
Open ETF positions:
Long - HHH, USO, UGA, SLV
Short - (none)
Deron Wagner is the Founder and Head Trader of both Morpheus Capital LP, a U.S. hedge fund, and Morpheus Trading Group, a trader education firm launched in 2001 that provides daily technical analysis of the leading ETFs and stocks. For a free trial to the full version of The Wagner Daily or to learn about Wagner's other services, visit MorpheusTrading.com or send an e-mail to deron@morpheustrading.com.
|