| Corcoran Technical Trading Patterns For March 26 |
| By Clive Corcoran |
Published
03/25/2009
|
Stocks
|
Unrated
|
|
|
|
Corcoran Technical Trading Patterns For March 26
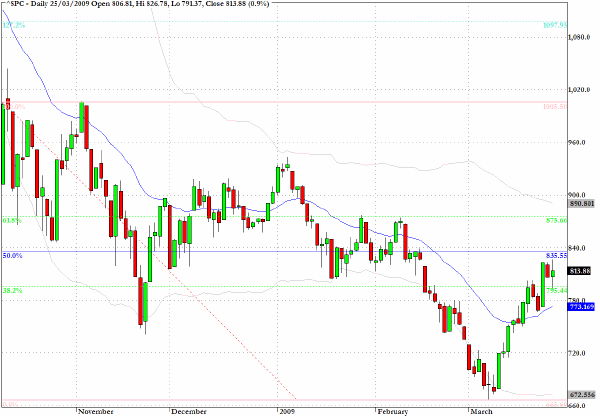
To begin today I want to take a purely technical look at the S&P 500 Cash Index (SPX) which I shall also be discussing this afternoon on CNBC's European Closing Bell .
The case can be made that the 1000 level on the S&P 500 is a critical upside possible target which would, if achieved, transform the suitable market nomenclature from one of a bear market rally into one of a new and embryonic bull market. Why 1000?
The closing level on October 14 was 998 and can be considered as the market's judgment on fair value after the major selling climax in mid October which saw the S&P 500 cover more than 20% in just three sessions.
The 1000 level also marked the very firm resistance levels seen during trading on both November 4th and 5th. Since those two sessions the S&P dropped almost 35%
If we take the low of 666 seen on March 6th and apply a fibonacci grid to the appropriate levels 795 is the 38% retracement level, 835 is the 50% level and 875 is the 62% retracement level.
We are currently between the 38% level and the 50% levels but during yesterday's highly volatile session, the last hour rescue attempt by the bulls succeeded in keeping us above 795.
I would expect us to head back up to the 835 level in the near term and could see some choppy price action between 840 and 860.
One can even imagine that under a longer time frame - during the next few weeks - the 875 could be challenged but what I would find much harder to imagine is that we can slice through 875 without a serious retrenchment.
Needless to say I am not optimistic that we will be seeing the 1000 level any time soon and, as previously indicated, it is more than conceivable that more financial accidents lie ahead over coming months which could put a re-test of the early March low back in play.
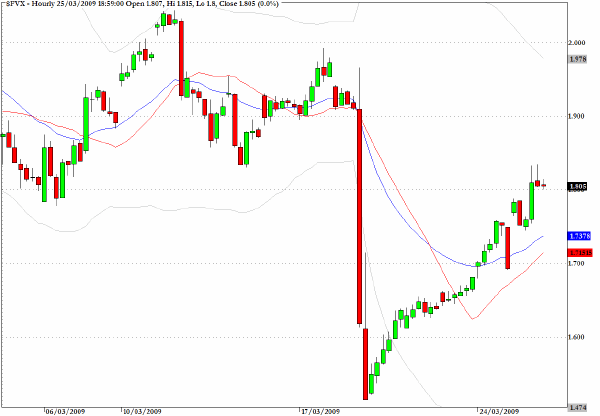
The hourly chart below shows that anyone buying the Five Year US Treasury Note after the QE announcement last week would have been losing money consistently ever since.
In addition the Treasury auction yesterday, which I alluded to in this column, did not go terribly well and adds further supply concerns to the sovereign credit market.
The US Treasury may have its worries about its refunding requirements this year with an estimated $2.5 trillion worth of bonds that need to find buyers but their problems are much less acute than those for the UK government where an auction yesterday for 40 year gilts was under-subscribed.
Coming on the heels of contradictory positions emerging between Prime Minister Brown and the Governor of the Bank Of England, with regard to future fiscal stimulus measures, the UK has to be careful how it steps in the global capital markets. It does not have the benefit of issuing Treasury paper in the global reserve currency as the US does (at least for the time being!) but that's a story for another day.
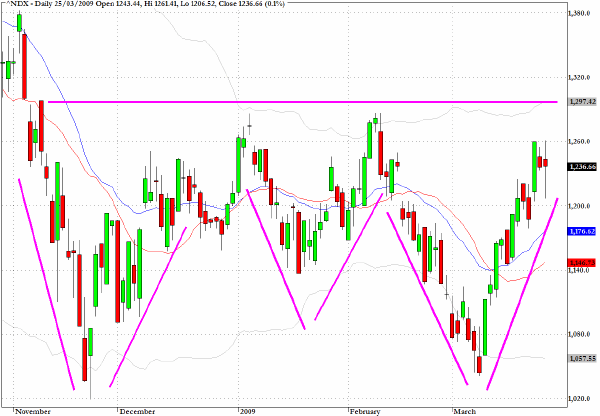
Annotated on the chart below for the the Nasdaq 100 Index (NDX) are clear and recurring V shapes that are characterizing the recovery efforts being mounted after each big sell-off.
These formations could also give rise to the notion that a W shaped bottom is evolving although the V in the middle is less convincing that its neighbors.
Another way of expressing reservation about the W pattern is to query what some other analysts are claiming is an inverse head and shoulders pattern and with the accompanying very bullish claim that should we break above the 1300 level we could be headed not only much higher, but also that this would no longer be symptomatic of a bear market rally.
The stakes are quite on how to interpret these patterns as a decisive break above 1300 would seem to be a game changing development. However for now I remain sceptical about this and would suggest, somewhat tongue in cheek, isn’t the head supposed to be larger than the shoulders?
I would be genuinely interested to hear from any readers who feel strongly that I am not seeing the pattern correctly and could post comments on this chart and associated posting on my blog site.
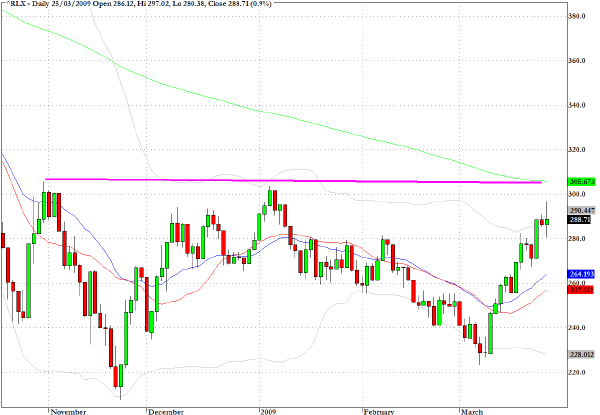
Another chart which is sending out a message that it would be unwise to get too complacent that the bulls have taken control of the agenda is the one below for the S&P Retail Index (RLX).
This index has failed a number of times at the 300 level and as can be seen the 200 day EMA has now moved down more or less to this level. It seems unlikely that - despite the notion that the markets discount 6-9 months ahead of the economy (at least that is the conventional wisdom) the retailing sector is about to be moving back into nascent bull market territory.
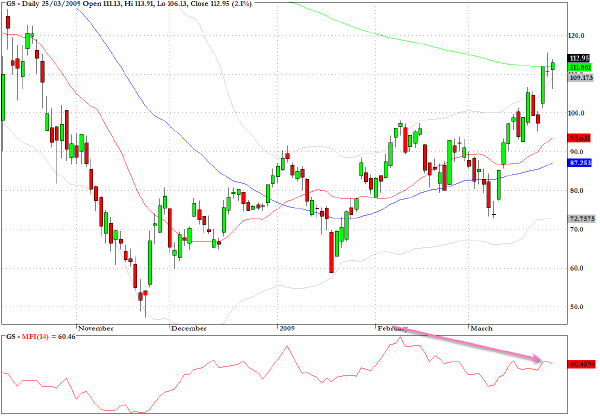
Goldman Sachs (GS) faces a challenge at the 200 day EMA which is very close to yesterday's closing level. The candlestick patterns of a doji star followed by a hanging man formation as well as the negative divergences on the MFI chart suggest that this stock could be at an intermediate term top.
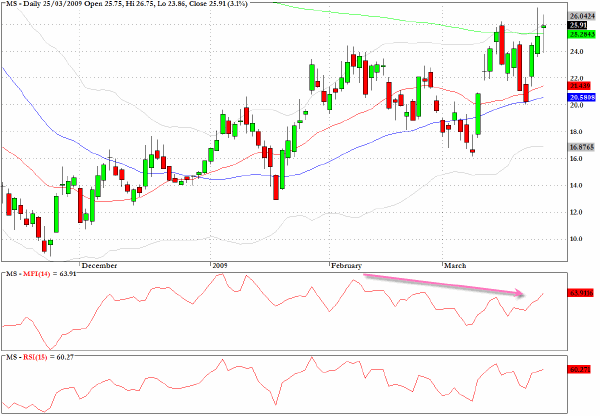
The only other Wall Street firm which still loosely resembles the old style investment banks - Morgan Stanley (MS) is also revealing very similar characteristics to those seen on the chart for Goldman Sachs.
I suspect that those who have been buying into the financial recovery story may pause to reflect on how much the underlying business environment has changed for the kinds of activities that enabled both banks to flourish during the 2003-2007 period.
Clive Corcoran is the publisher of TradeWithForm.com, which provides daily analysis and commentary on the US stock market. He specializes in market neutral investing and and is currently working on a book about the benefits of trading with long/short strategies, which is scheduled for publication later this year.
Disclaimer
The purpose of this article is to offer you the chance to review the trading methodology, risk reduction strategies and portfolio construction techniques described at tradewithform.com. There is no guarantee that the trading strategies advocated will be profitable. Moreover, there is a risk that following these strategies will lead to loss of capital. Past results are no guarantee of future results. Trading stocks and CFD's can yield large rewards, but also has large potential risks. Trading with leverage can be especially risky. You should be fully aware of the risks of trading in the capital markets. You are strongly advised not to trade with capital.
|