| Corcoran Technical Trading Patterns For March 27 |
| By Clive Corcoran |
Published
03/27/2009
|
Stocks
|
Unrated
|
|
|
|
Corcoran Technical Trading Patterns For March 27
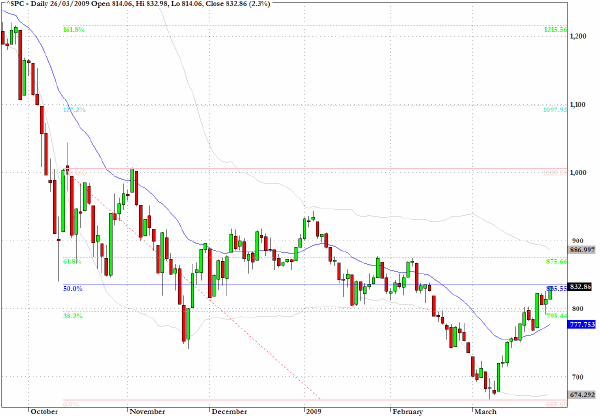
The S&P 500 continued to rally yesterday and almost satisfied the target of 835 that I specified in yesterday's commentary and during a CNBC Europe slot. This level would coincide with a 50% retracement of the 1000 high level and the 666 level as discussed yesterday.
In fact, to do the arithmetic precisely would give a value of 833 which was within two basis points of yesterday's high.
As discussed below, I do believe that we are approaching the top of the rally that has been in place since the early March low.
With window dressing for the end of Q1 just around the corner and with earnings releases approaching, there is scope for further upside into what I would consider the danger zone for this most recent rebound - the 850-875 zone - and I would suggest that the chances of a sudden drop are increasing such that stepping aside and retiring profitable long positions is the way to go.
I would not be contemplating short index futures positions at the current time but rather looking for topping-out profiles among some large cap stocks that have moved very well over the last two weeks and appear to be ready for corrections.
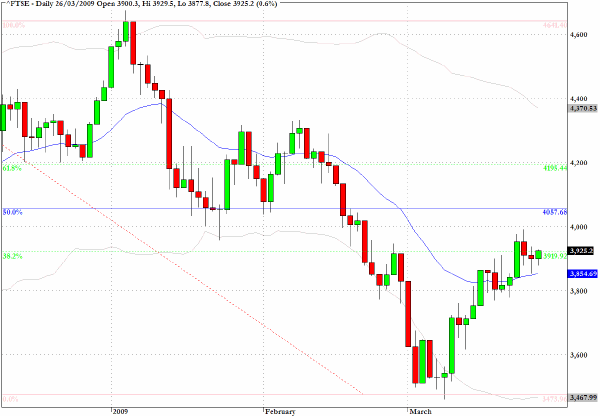
The FTSE in the UK has not been making commensurate progress in comparison to the broad US equity indices and has so far been unable to gain a foothold above the psychologically important 4000 level.
Using similar reasoning to that proposed in yesterday's commentary, it would seem that the fibonacci grid applied to the FTSE suggests that the index has not yet convincingly cleared the 38% retracement level from key swing highs and lows seen during the last several months
If the index fails to remain above the 3900 level in coming days there is considerable downside risk as this would also violate the uptrend line through the lows since early March.
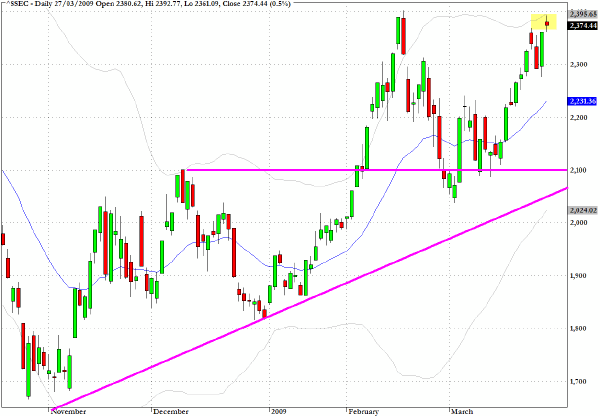
The Shanghai market (SSEC) registered a tiny doji star in Friday's trading at a potential intermediate term double top.
There is a key support line in the region of 2100 if the expected pullback gains momentum.
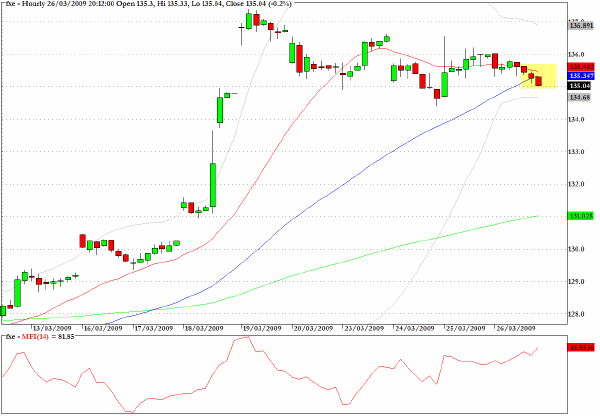
In trading on Friday, the euro is sliding against the dollar. I have included the exchange traded FXE which allows easy access to this key cross rate and as of Thursday's close in US trading the currency broke below key moving average support.
A retest of the $1.30 level could be on the cards in coming days.
As previously intimated, rather than looking at a short position in index futures or the exchange traded proxies such as SPY and QQQQ, I would be looking for short opportunities in several stocks that seem to be ripe for pullbacks.
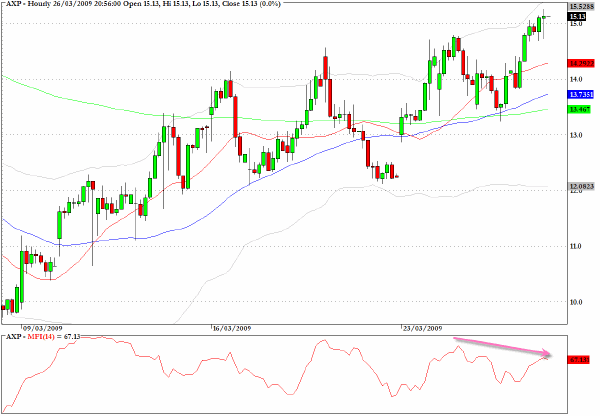
The hourly chart for American Express (AXP) looks over-extended and there is a negative money flow divergence.
There is the potential here for a pullback to the $13 level.
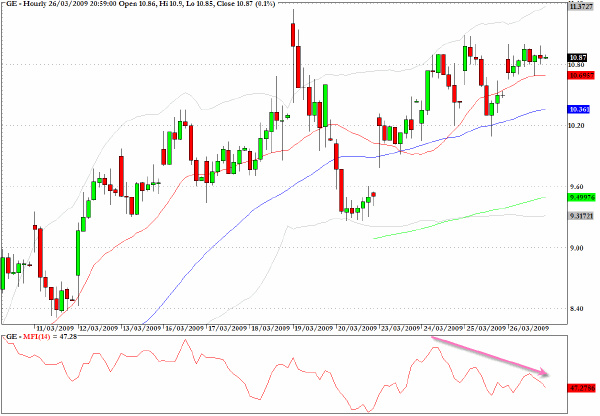
In similar vein to the discussion for AXP, I would also suggest that after reviewing the hourly chart for General Electric there is similar evidence of poor money flow during the rally of the last few sessions.
This raises the possibility that more volume has been going into distribution rather than accumulation and a feasible price target would be around $9.60 (i.e. at the 200 hour EMA which is the green line on the chart).
Clive Corcoran is the publisher of TradeWithForm.com, which provides daily analysis and commentary on the US stock market. He specializes in market neutral investing and and is currently working on a book about the benefits of trading with long/short strategies, which is scheduled for publication later this year.
Disclaimer
The purpose of this article is to offer you the chance to review the trading methodology, risk reduction strategies and portfolio construction techniques described at tradewithform.com. There is no guarantee that the trading strategies advocated will be profitable. Moreover, there is a risk that following these strategies will lead to loss of capital. Past results are no guarantee of future results. Trading stocks and CFD's can yield large rewards, but also has large potential risks. Trading with leverage can be especially risky. You should be fully aware of the risks of trading in the capital markets. You are strongly advised not to trade with capital.
|