| The McMillan Options Strategist Weekly |
| By Lawrence G. McMillan |
Published
03/27/2009
|
Options
|
Unrated
|
|
|
|
The McMillan Options Strategist Weekly
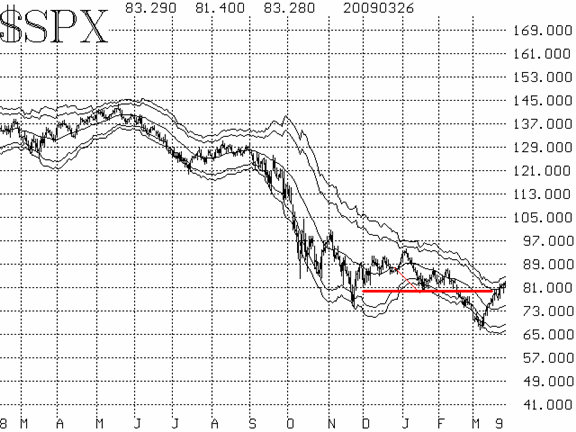
A very rare, true "V" bottom (at least for the time being) was formed in early March. There hasn't been a meaningful correction since, and most of our indicators are overbought as a result. The next pullback should help define whether this was just another rally in a bear market or if a more significant intermediate-term move is under way.

$SPX has rallied so strongly that it has gained 170 points in just over two weeks. As a result, it has bumped against and even exceeded both the 2- and 3-standard deviation Bollinger Bands. This is a rare overbought occurrence indeed, and normally means that an immediate pullback to the 20-day moving average is called for. That average is currently at about $SPX 750.
If $SPX pulls back to its 20-day moving average and then starts to move higher again, it will have finally established a "higher low" in comparison to the early March low. Should it then exceed the highs that preceded that pullback, then a "higher high" would be in place as well. That combination of higher high and higher low would be bullish and would turn the $SPX chart to intermediate-term bullish.

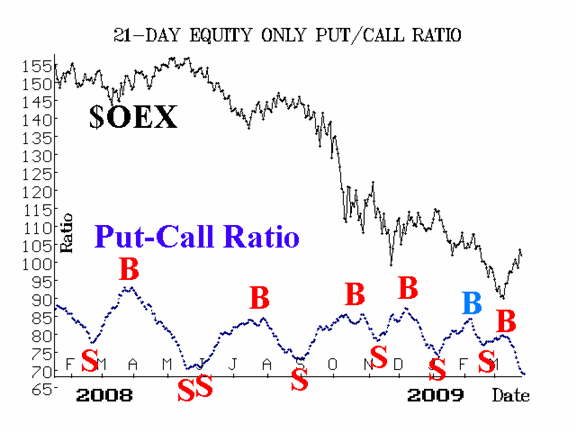
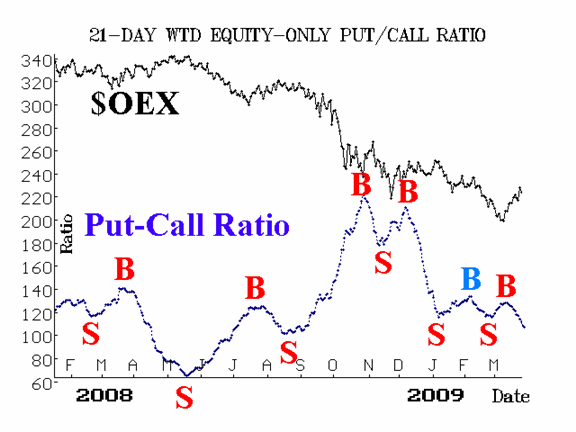
The equity-only put-call ratios are bullish as well, as they continue to decline. The standard ratio is making new lows, which means it is yet another overbought indicator. The weighted chart has more room to decline before it would be considered seriously overbought.

Market breadth is quite overbought as well. There have been five "90% up days" (two of which were up volume days) since we last published. NYSE data shows four such days.
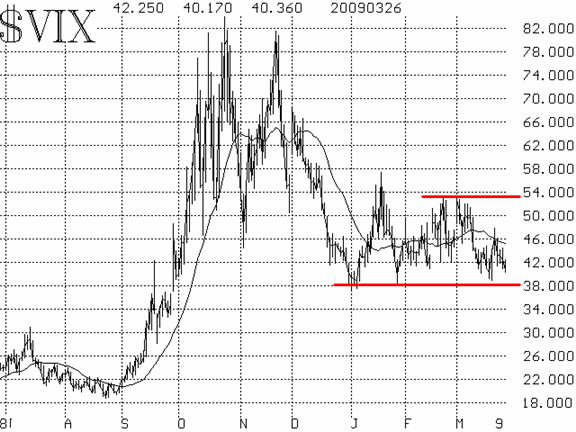
Volatility indices ($VIX and $VXO) have not responded in typical fashion. They remain in trading ranges. For $VIX, that range is 38 to 53. A close below 38 would be bullish, but at these levels $VIX is neutral, although it does indicate that price swings will continue to be very large.

This market -- which was so bearish just three weeks ago -- is now so bullish that it is not responding negatively to overbought conditions at all. It is normally quite bullish for the initial stages of a new upward move to get overbought and stay that way.
In summary, on the short term, we expect a retracement to at least the 50-day moving average -- soon (it might not happen until after the end of the quarter, though, as window dressing becomes important). After that, we'll see what develops: if the market bounces off the 20- day moving average and new relative highs are made, we'd adopt a bullish opinion. But if the retracement becomes something larger, slicing on down through the 20-day moving average, then we'd stay with bearish positions.
Lawrence G. McMillan is the author of two best selling books on options, including Options as a Strategic Investment, recognized as essential resources for any serious option trader's library.
|