|
The Wagner Daily ETF Report For March 31
The pullback mode that began last Friday carried over into yesterday's session, causing the main stock market indexes to register a second straight day of large losses. Stocks opened substantially lower, sold off further in the morning, then drifted sideways to lower throughout the rest of the day. The Nasdaq Composite slid 2.8%, the Dow Jones Industrial Average 3.3%, and the S&P 500 3.5%. The small-cap Russell 2000 and S&P Midcap 400 indices declined 3.0% and 3.5% respectively. The S&P and Dow closed around the bottom quarter of their intraday trading ranges, but slight relative strength in the Nasdaq enabled the tech-heavy index to finish in the middle of its range.
Turnover was mixed. Total volume in the Nasdaq was 5% lighter than the previous day's level, enabling the index to dodge a "distribution day." In the NYSE, however, volume edged 4% higher, indicating the presence of institutional selling in the S&P 500. It was the S&P's second confirmed day of higher volume losses since the March 10 reversal off the lows. The Nasdaq has only registered one "distribution day" during the same period. A typical uptrending market can survive an occasional bout of institutional selling without technical damage, but more than three days of higher volume losses within a one-month period usually creates enough pressure to trigger a significant downside correction. In healthy markets, a majority of "down" days should be on lighter volume, while a fair number of "up" days should be accompanied by increasing volume. As such, we'll be closely monitoring the stock market's price to volume patterns this week for possible early warning signs of institutional selling ahead of the crowd.
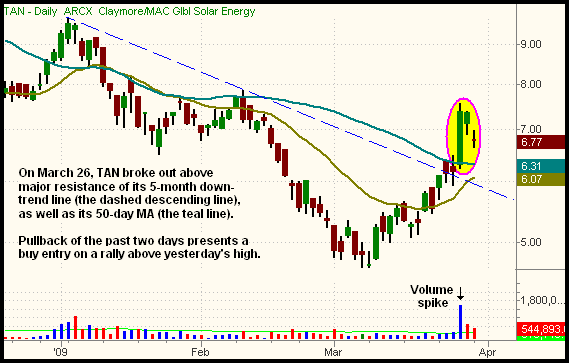
Assuming the broad market holds up, one ETF we're stalking for potential buy entry this week is Claymore Global Solar Energy (TAN). The setup is illustrated on the daily chart below:

On March 26, TAN convincingly broke out above resistance of both its 50-day moving average and five-month downtrend line. Confirming the breakout was a major volume spike, where turnover swelled to five times its average level. Over the past two days, TAN has pulled back alongside of the broad market, but has shown relative strength to the major indices. Notice it has only retraced a little more than half of its March 26 gain. Because of its recent high-volume breakout, as well as its newfound relative strength, TAN should be among the first ETFs to surge higher when the broad-based indexes start to head back up. Even in the event the main stock market indexes fail to rally back to their recent highs, TAN should fall a lesser percentage than the overall market. Regular subscribers to The Wagner Daily will see our detailed trigger, stop, and target prices for the TAN setup below.
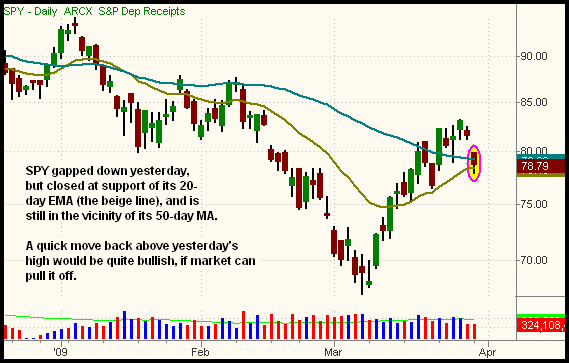
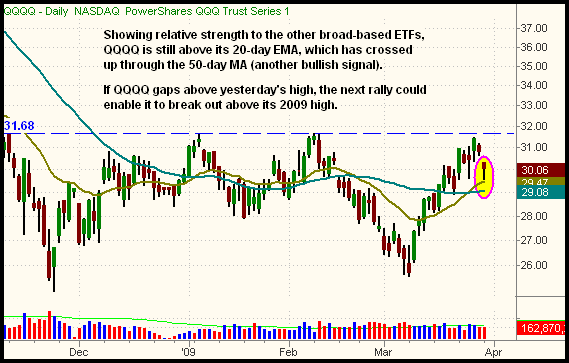
In yesterday's commentary, we said, "if last Friday's weakness continues straight into today's session, keep a close eye on whether or not the main stock market indexes manage to hold new support of their 50-day moving averages (792 for S&P 500, 1,463 for Nasdaq Composite, and 7,597 for the Dow)." So, how did the major indices fare? Both the S&P and Dow sold off to close below their 50-day MAs, but by less than 1%. Both the Nasdaq Composite and Nasdaq 100 Index, despite two days of sharp losses, remain approximately 3% above their 50-day MAs. Also bullish is the fact that yesterday's lows in both the S&P and Dow coincided with support of their 20-day exponential moving averages, a reliable indicator of short-term trend direction. Below are daily charts of the S&P 500 SPDR (SPY) and PowerShares QQQ Trust (QQQQ), popular ETF proxies for the S&P 500 and Nasdaq 100 indices:


Even though the S&P and Dow closed below their 50-day MAs yesterday, there is not yet any cause for alarm; a brief dip below the 50-day moving average of less than 3% is commonly accepted to be just a "shakeout." For many technicians, only a violation of more than 3% below a key moving average is considered deep enough to confirm a break of support. Further, a brief probe below the 50-day MA is actually bullish if the price quickly moves back above the moving average one to two sessions later.
Because of the S&P and Dow testing support of their 50-day MAs, the Nasdaq's close in the upper half of its intraday range, and even relative strength displayed by leading individual stocks yesterday, the market is acting as though the current pullback may be short-lived. However, because the stock market may still need to run its course with another day or two of selling, it's always safer to wait for some type of price confirmation before buying any broad-based ETFs on this pullback. A simple, yet very effective strategy is just to wait for one or more of the major indices to rally above yesterday's high and hold. If the Nasdaq becomes the first to do so, it may present a nice entry to swing trade QQQQ on the long side, though a little price consolidation would make a subsequent breakout above the February highs more likely to stick.
Open ETF positions:
Long - USO, UGA, SLV, HHH, UDN
Short - (none)
Deron Wagner is the Founder and Head Trader of both Morpheus Capital LP, a U.S. hedge fund, and Morpheus Trading Group, a trader education firm launched in 2001 that provides daily technical analysis of the leading ETFs and stocks. For a free trial to the full version of The Wagner Daily or to learn about Wagner's other services, visit MorpheusTrading.com or send an e-mail to deron@morpheustrading.com.
|