| Corcoran Technical Trading Patterns For March 31 |
| By Clive Corcoran |
Published
03/31/2009
|
Stocks
|
Unrated
|
|
|
|
Corcoran Technical Trading Patterns For March 31
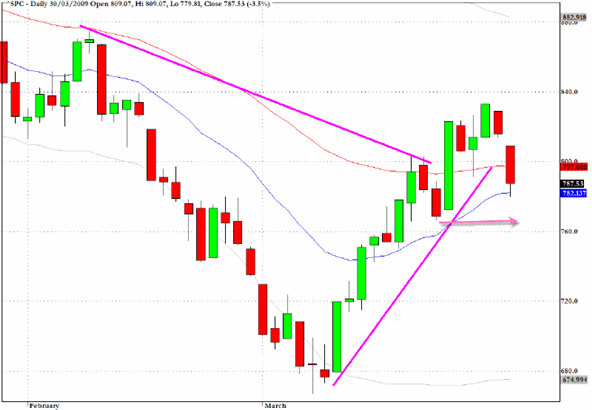
Yesterday’s commentary anticipated the drop in the S&P 500 (SPX) down to the 780 level. While the chart below shows that the critical break down suffered yesterday tips the presumption back in favor of an eventual retreat to lower levels, there are some mitigating factors to consider.
Firstly, the fact that the index managed to bounce exactly off the 780 level and secondly the overall low volumes will restrain me from playing the short side in today’s session.
Turnaround Tuesdays have been in evidence throughout this bear market and one could easily be mounted after yesterday’s rout.
The bearish case would become more compelling if the 766 level (marked on the chart and the intraday low from March 20th) was to break and in general terms if there is evidence that volume picks up on renewed selling in coming days.
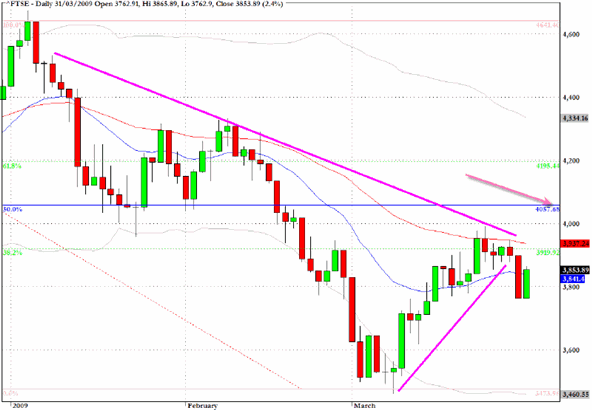
The FTSE is recovering in trading on Tuesday morning but while it remains below the 3900 level the chart pattern is suggesting further weakness ahead.
A close above 4060 would be required to turn me more bullish on this index.
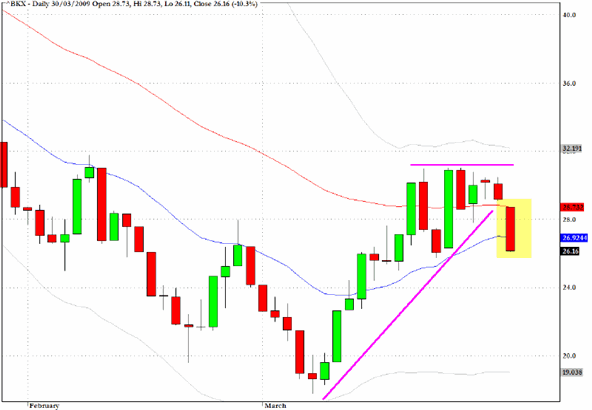
The KBW Banking Index (BKX) gave back ten percent yesterday with double digit percentage falls being registered in Citigroup (C), Bank of America (BAC) and Wells Fargo (WFC).
The rupture of the upward trendline from the early March low is certainly a cause for concern but for the many reasons which I have adduced over the last few weeks I would be surprised to see us head back to new lows for this sector.
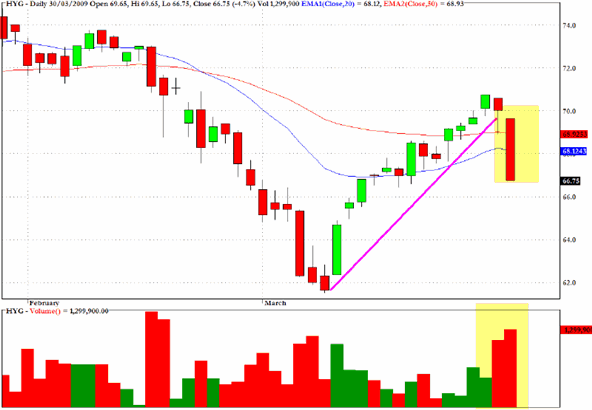
HYG, which tracks the high yield corporate bond market has also broken below key trendlines and notably, in this instance, this has been accompanied by a pickup in volume.
Government statistics and anecdotal evidence are pointing to increasing deterioration in many regions of the global economy, with perhaps the US seeing some signs of a respite, but on balance this suggests that default levels on junk bonds will be towards the upper end of the increasingly more gloomy forecasts for this asset class.
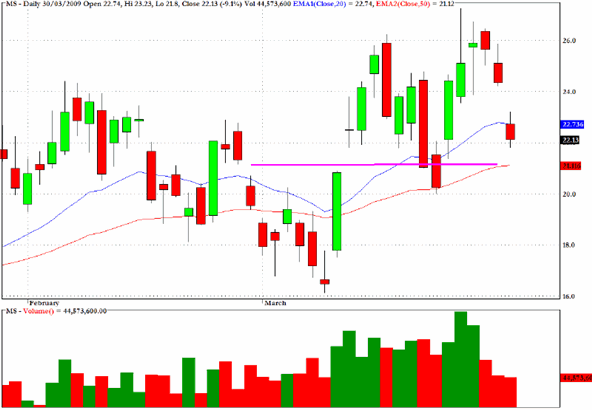
Last Thursday I discussed the topping formations on both Goldman Sachs (GS) and Morgan Stanley (MS). Both stocks have sold off since but the better place to have been from the short side would have been Morgan Stanley.
Notice on the chart below that the volume has been subdued on the selloff and there is support below yesterday’s close at $21 level which coincides with the 50-day moving average.
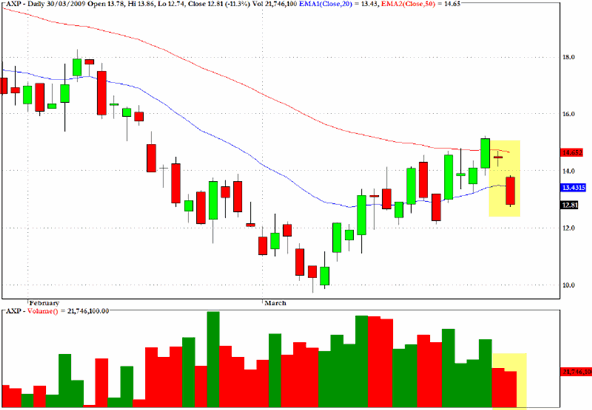
Here are my comments from last Friday’s column regarding American Express
The hourly chart for American Express (AXP) looks over-extended and there is a negative money flow divergence.
There is the potential here for a pullback to the $13 level.
The stock pulled back to the $12.80 level in yesterday’s session and could have delivered a 15% plus return from going short on Friday’s open.
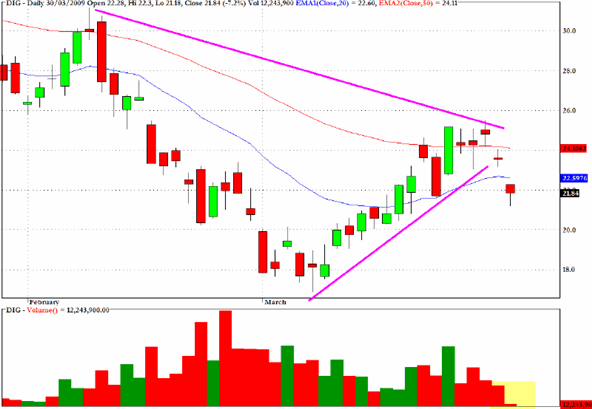
DIG which tracks the energy sector and is based on the Ultra Dow Jones Oil and Gas Index is moving very much in sync with US equities as revealed in the chart below.
The close was below both the 20 and 50-day moving averages and the triangular pattern is clearly broken.
Once again the volume was light yesterday although the turn down in money flow is more acute in this sector than in many other sector based ETF’s.
Clive Corcoran is the publisher of TradeWithForm.com, which provides daily analysis and commentary on the US stock market. He specializes in market neutral investing and and is currently working on a book about the benefits of trading with long/short strategies, which is scheduled for publication later this year.
Disclaimer
The purpose of this article is to offer you the chance to review the trading methodology, risk reduction strategies and portfolio construction techniques described at tradewithform.com. There is no guarantee that the trading strategies advocated will be profitable. Moreover, there is a risk that following these strategies will lead to loss of capital. Past results are no guarantee of future results. Trading stocks and CFD's can yield large rewards, but also has large potential risks. Trading with leverage can be especially risky. You should be fully aware of the risks of trading in the capital markets. You are strongly advised not to trade with capital.
|